The Knowledge Portals can help you determine the pattern of trait associations for a variant or gene of interest. This can help answer common questions in several types of research:
- basic research: Does a variant have pleiotropic effects on multiple diseases or traits?
- clinical research: Can we use patient genetics to cluster them into disease subgroups, which could help improve disease treatment?
- translational research: Will modulation of a candidate drug target have adverse effects on other traits?
Here we illustrate the interfaces in the Knowledge Portals that can help answer these questions.
This guide will use "phenotype" as a generic term to denote a disease or trait. Although the screenshots show the Common Metabolic Diseases Knowledge Portal, this guide is applicable to most other Knowledge Portals.
The Knowledge Portals offer four major avenues for multi-trait analysis:
1. Determine the pattern of associations for a variant.
2. Stack up LocusZoom plots to view associations for multiple phenotypes across a genetic locus.
3. Use the Signal Sifter to find variants with a custom pattern of associations.
4. Use the Gene Sifter to find genes with a custom set of gene-level associations.
1. Determine the pattern of associations for a variant.
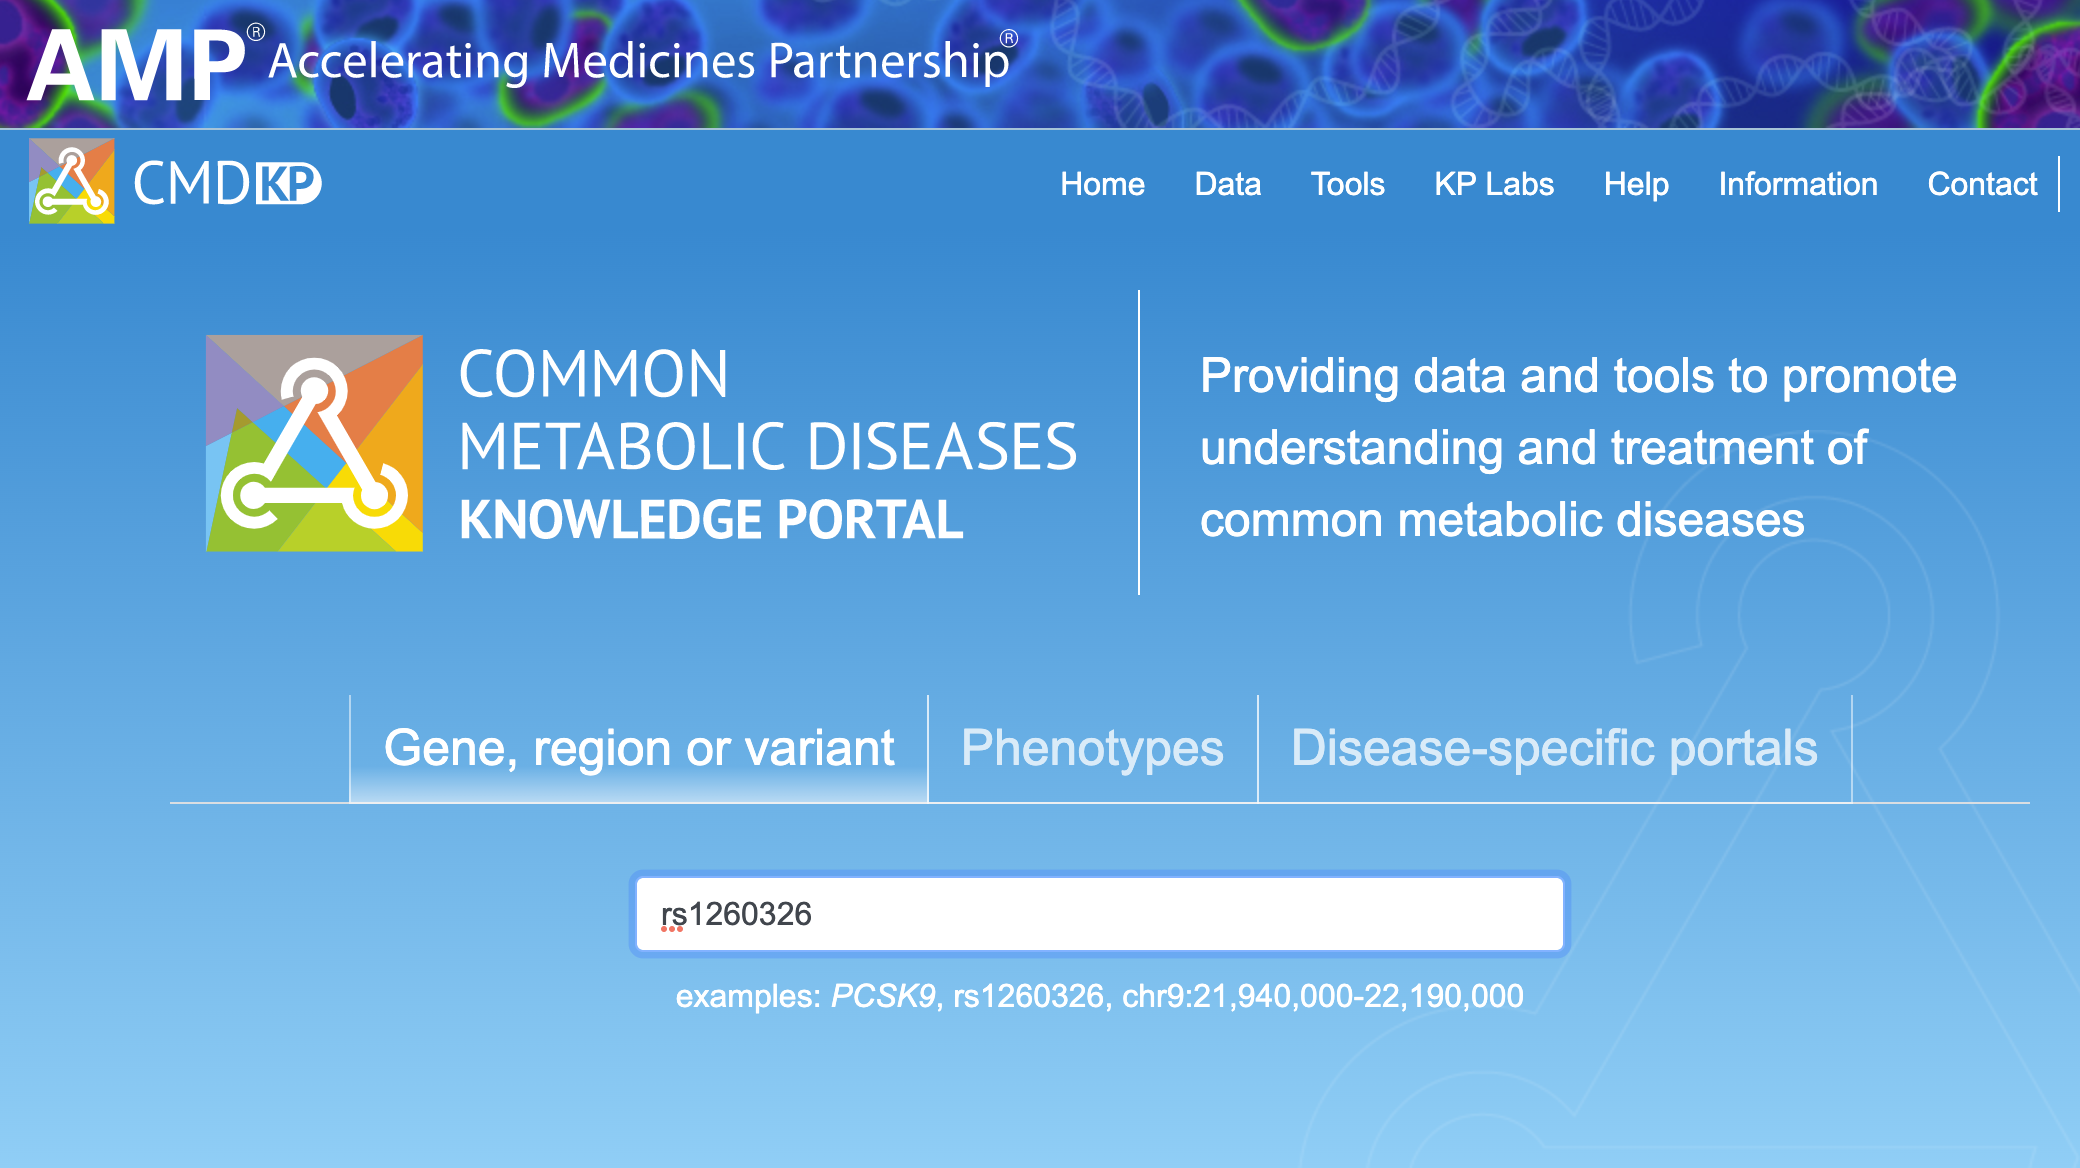
The PheWAS and forest plots on the Variant page summarize the pattern of associations across traits for that variant. Navigate to a Variant page by typing or pasting a variant ID or rsID into the home page search box:
On the Variant page, scroll down to the PheWAS plot:
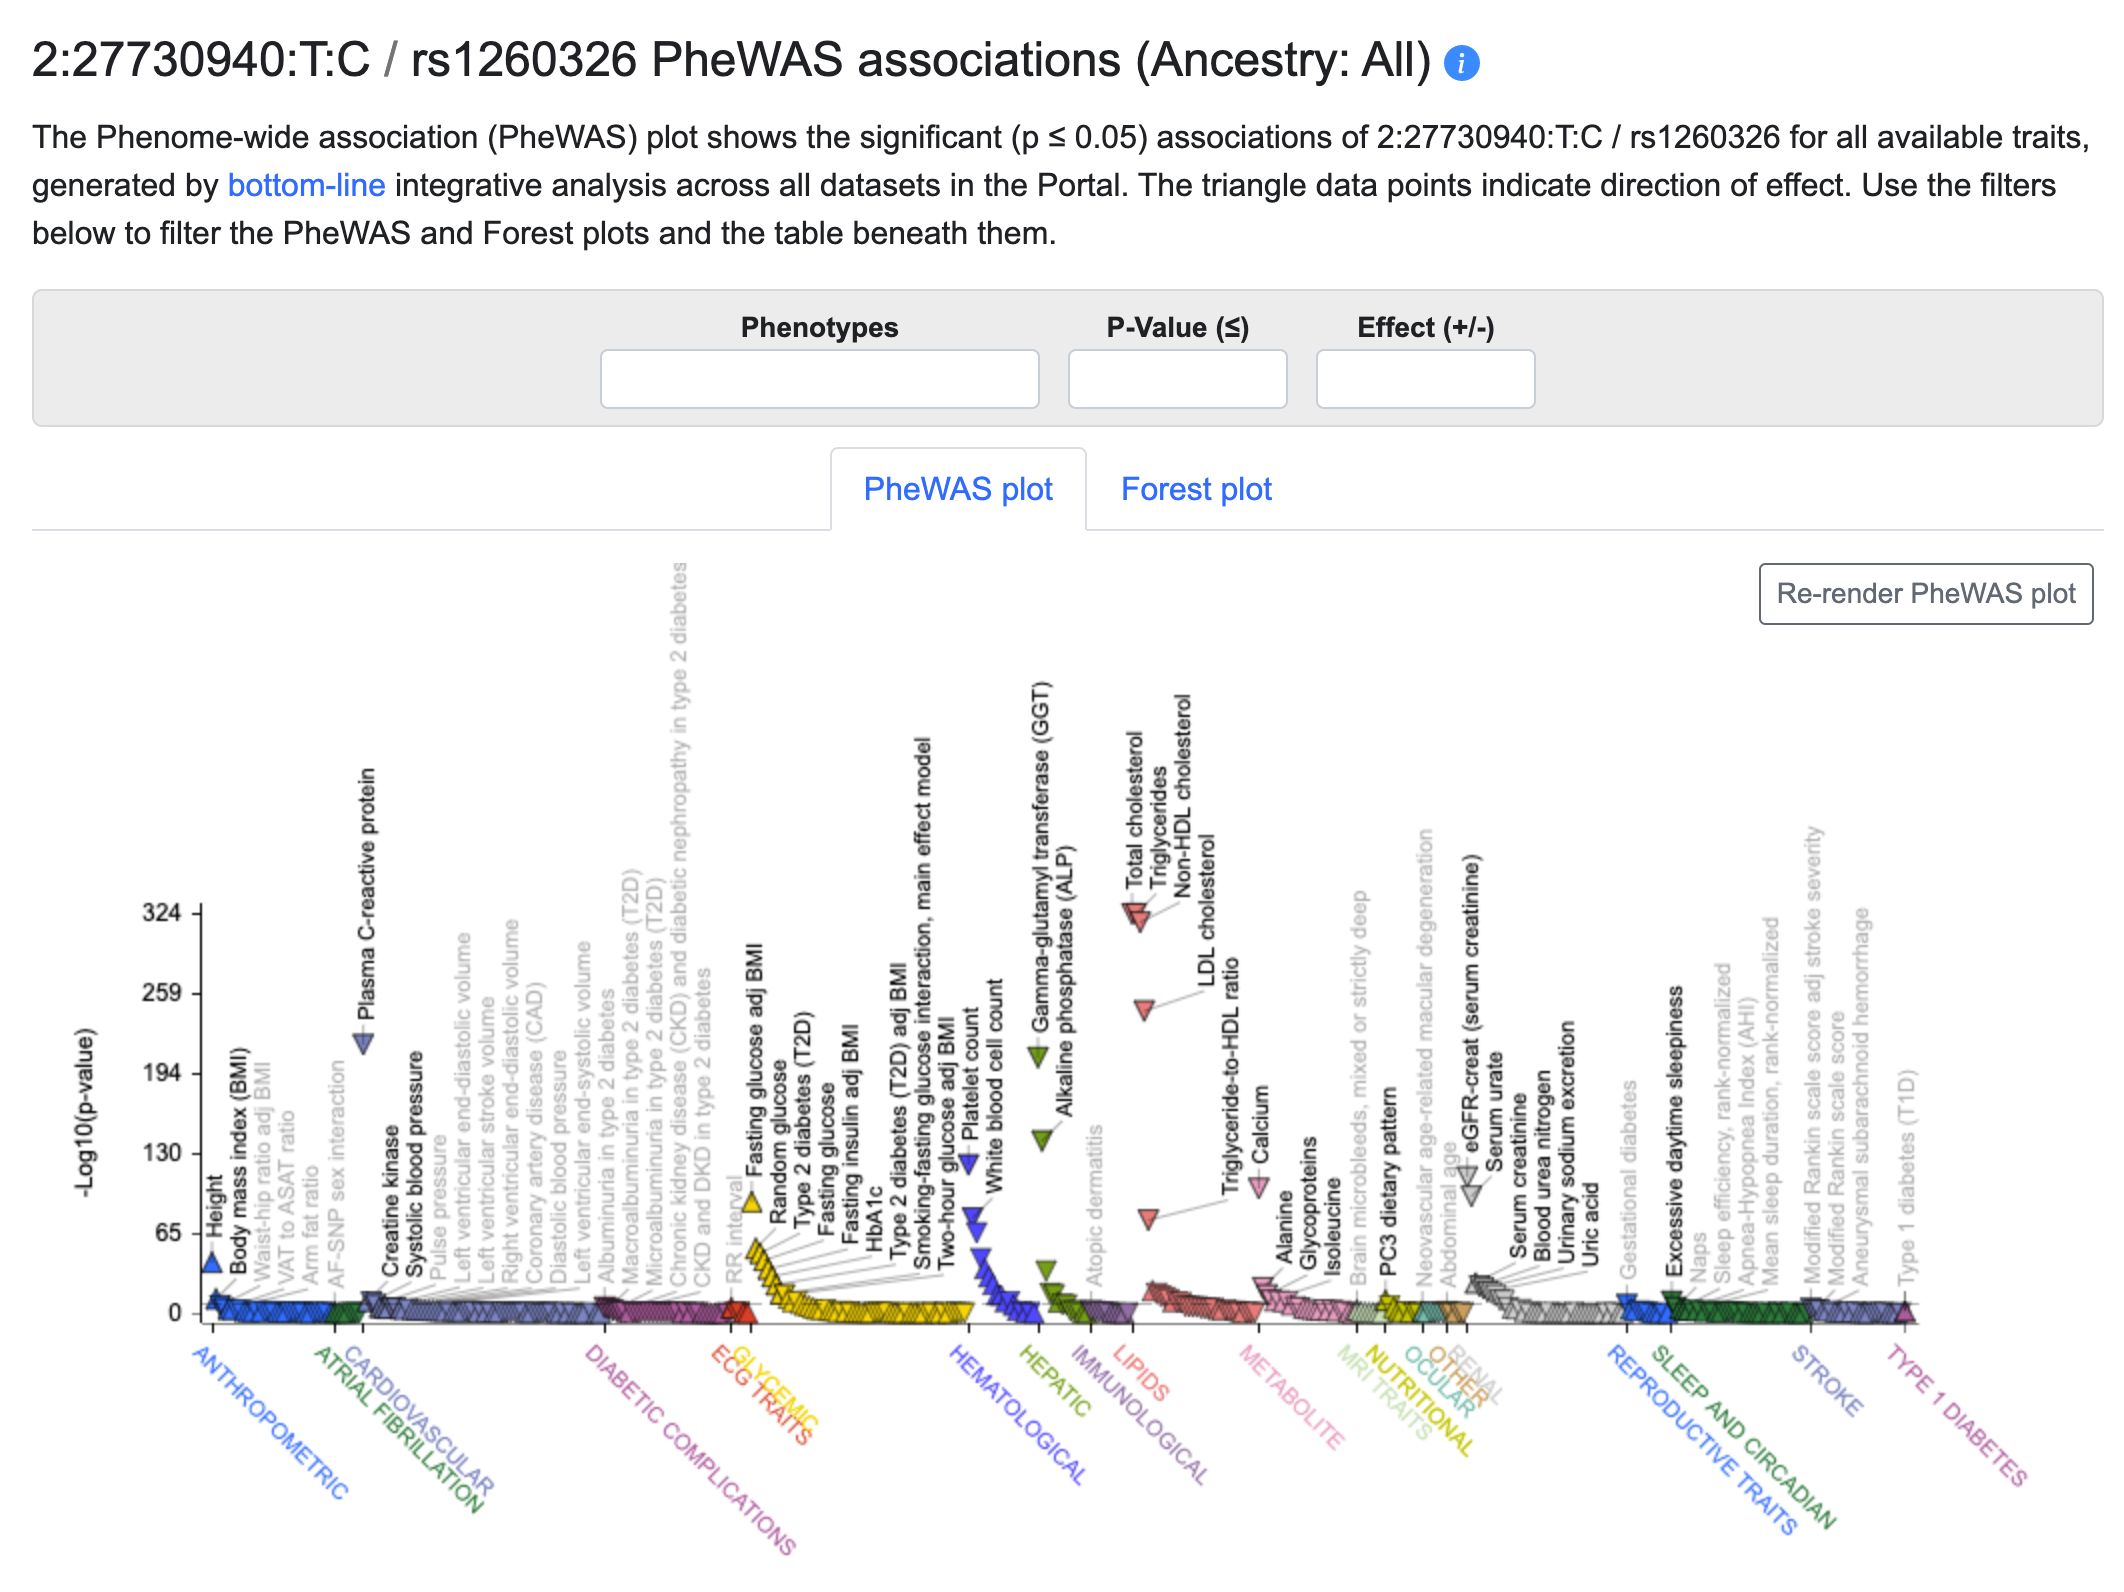
The plot shows all of the associations for the variant (rs1260326 in this example) across all of the phenotypes included in the Knowledge Portal you are viewing. The associations are generated by bottom-line integrative analysis across all datasets for each phenotype. The orientation of the triangle marking each point indicates the direction of effect for the association. All of the data in the plot are included in the table directly beneath it.
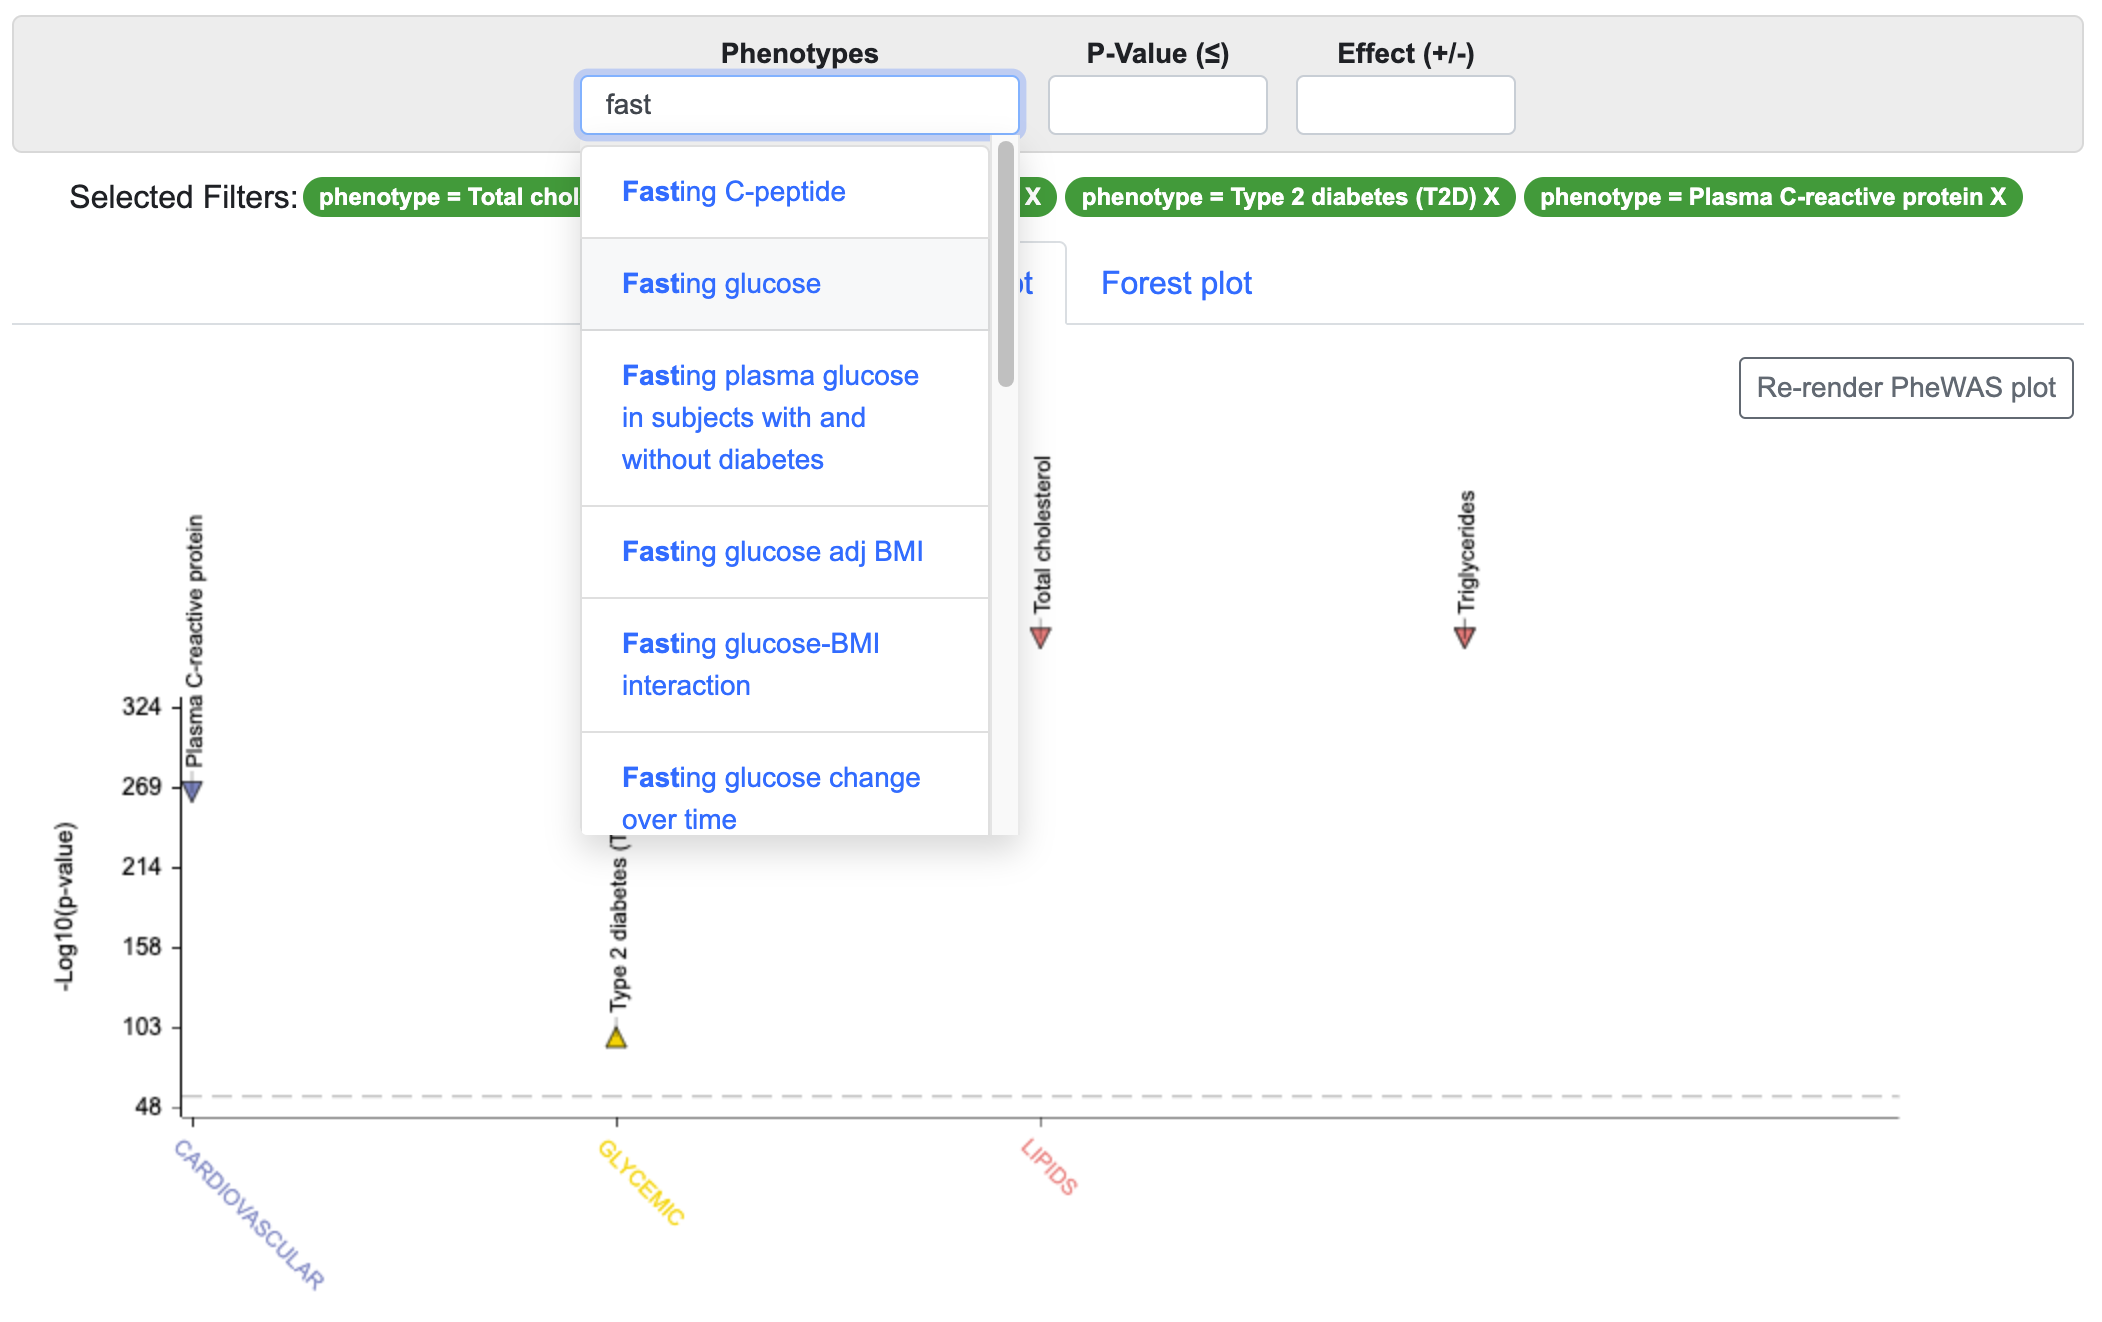
Using the Phenotypes search box above the plot, you can select as many phenotypes as desired and filter the plot and table to display only those phenotypes. You can also set a p-value threshold and select positive or negative direction of effect.
Click on the Forest plot tab to see an alternative view of the same data:
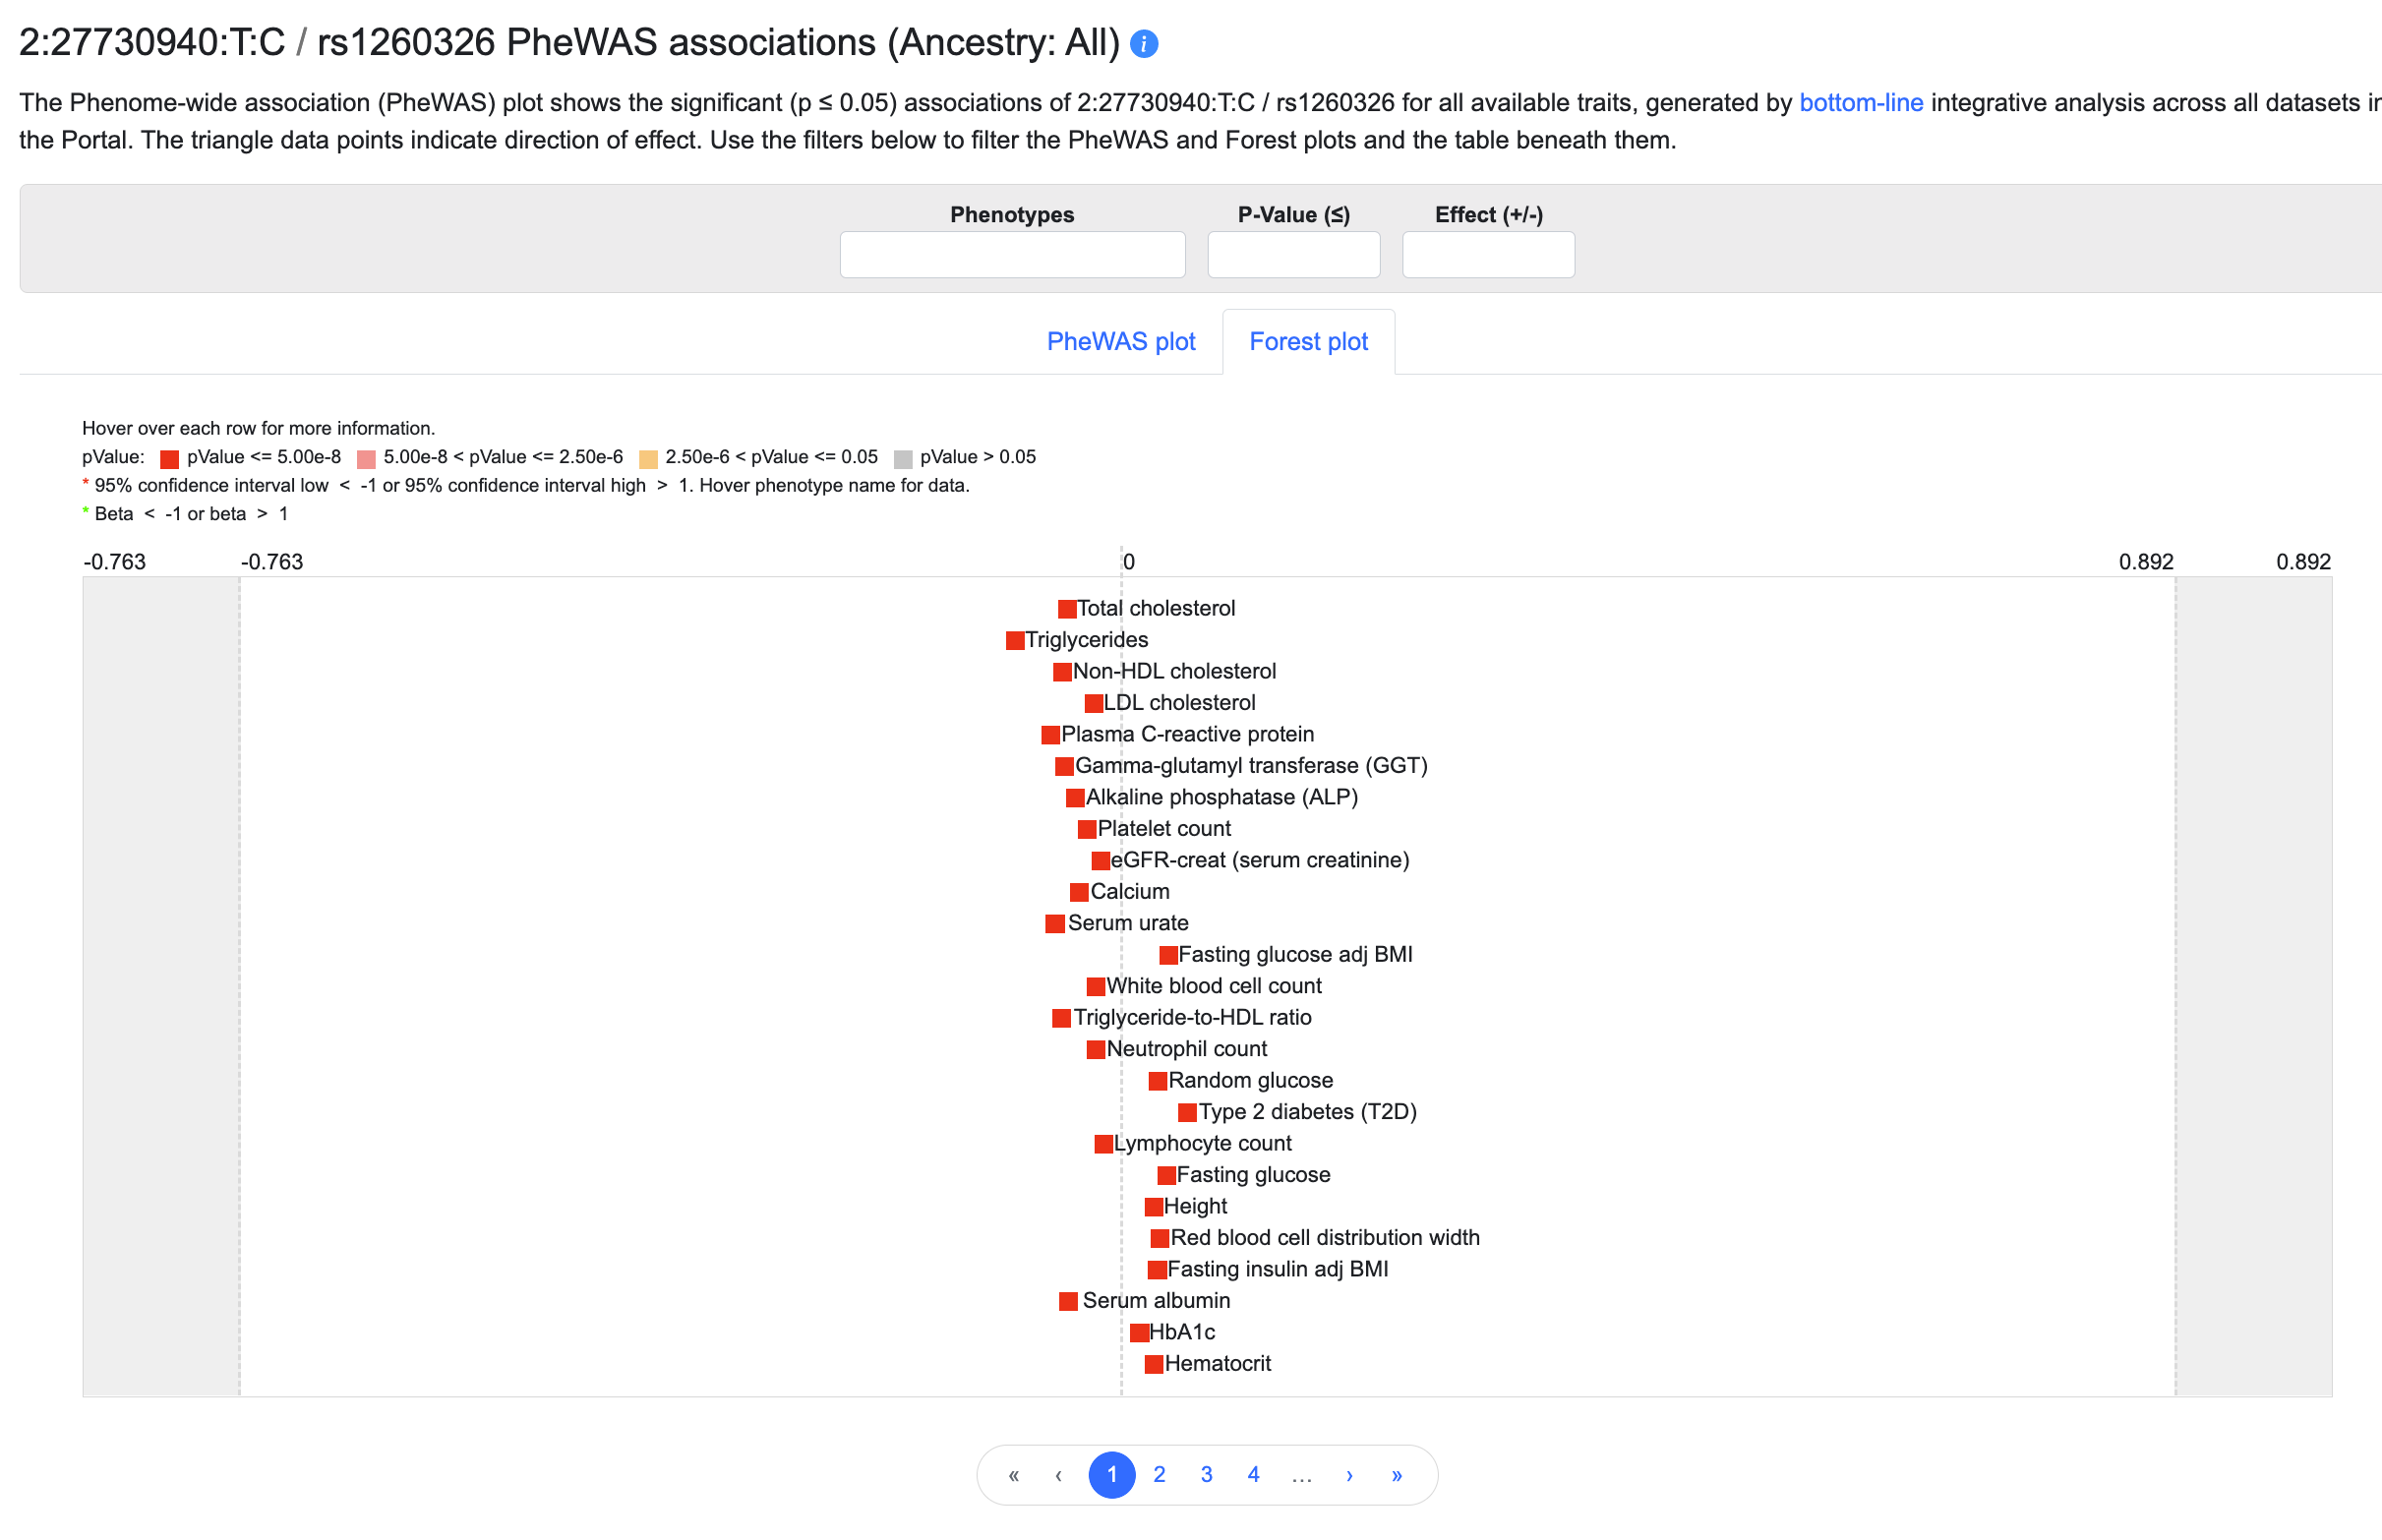
In addition to showing p-value ranges and directions of effect, the forest plot displays a graphical indication of effect size for each association. The plot may be filtered in the same way as the PheWAS plot.
To restrict the PheWAS and forest plot displays to ancestry-specific associations, scroll up to the top of the page and open the Set page level parameters section:

Select an ancestry and click GO to update the plots.
2. Stack up LocusZoom plots to view associations for multiple phenotypes across a genetic locus.
Navigate to the Region page by entering a gene name in the search box on the home page. The Region page shows associations spanning the coding sequence of the gene plus 50kb of flanking sequences.
Scroll down to the Genomic Region Miner module:
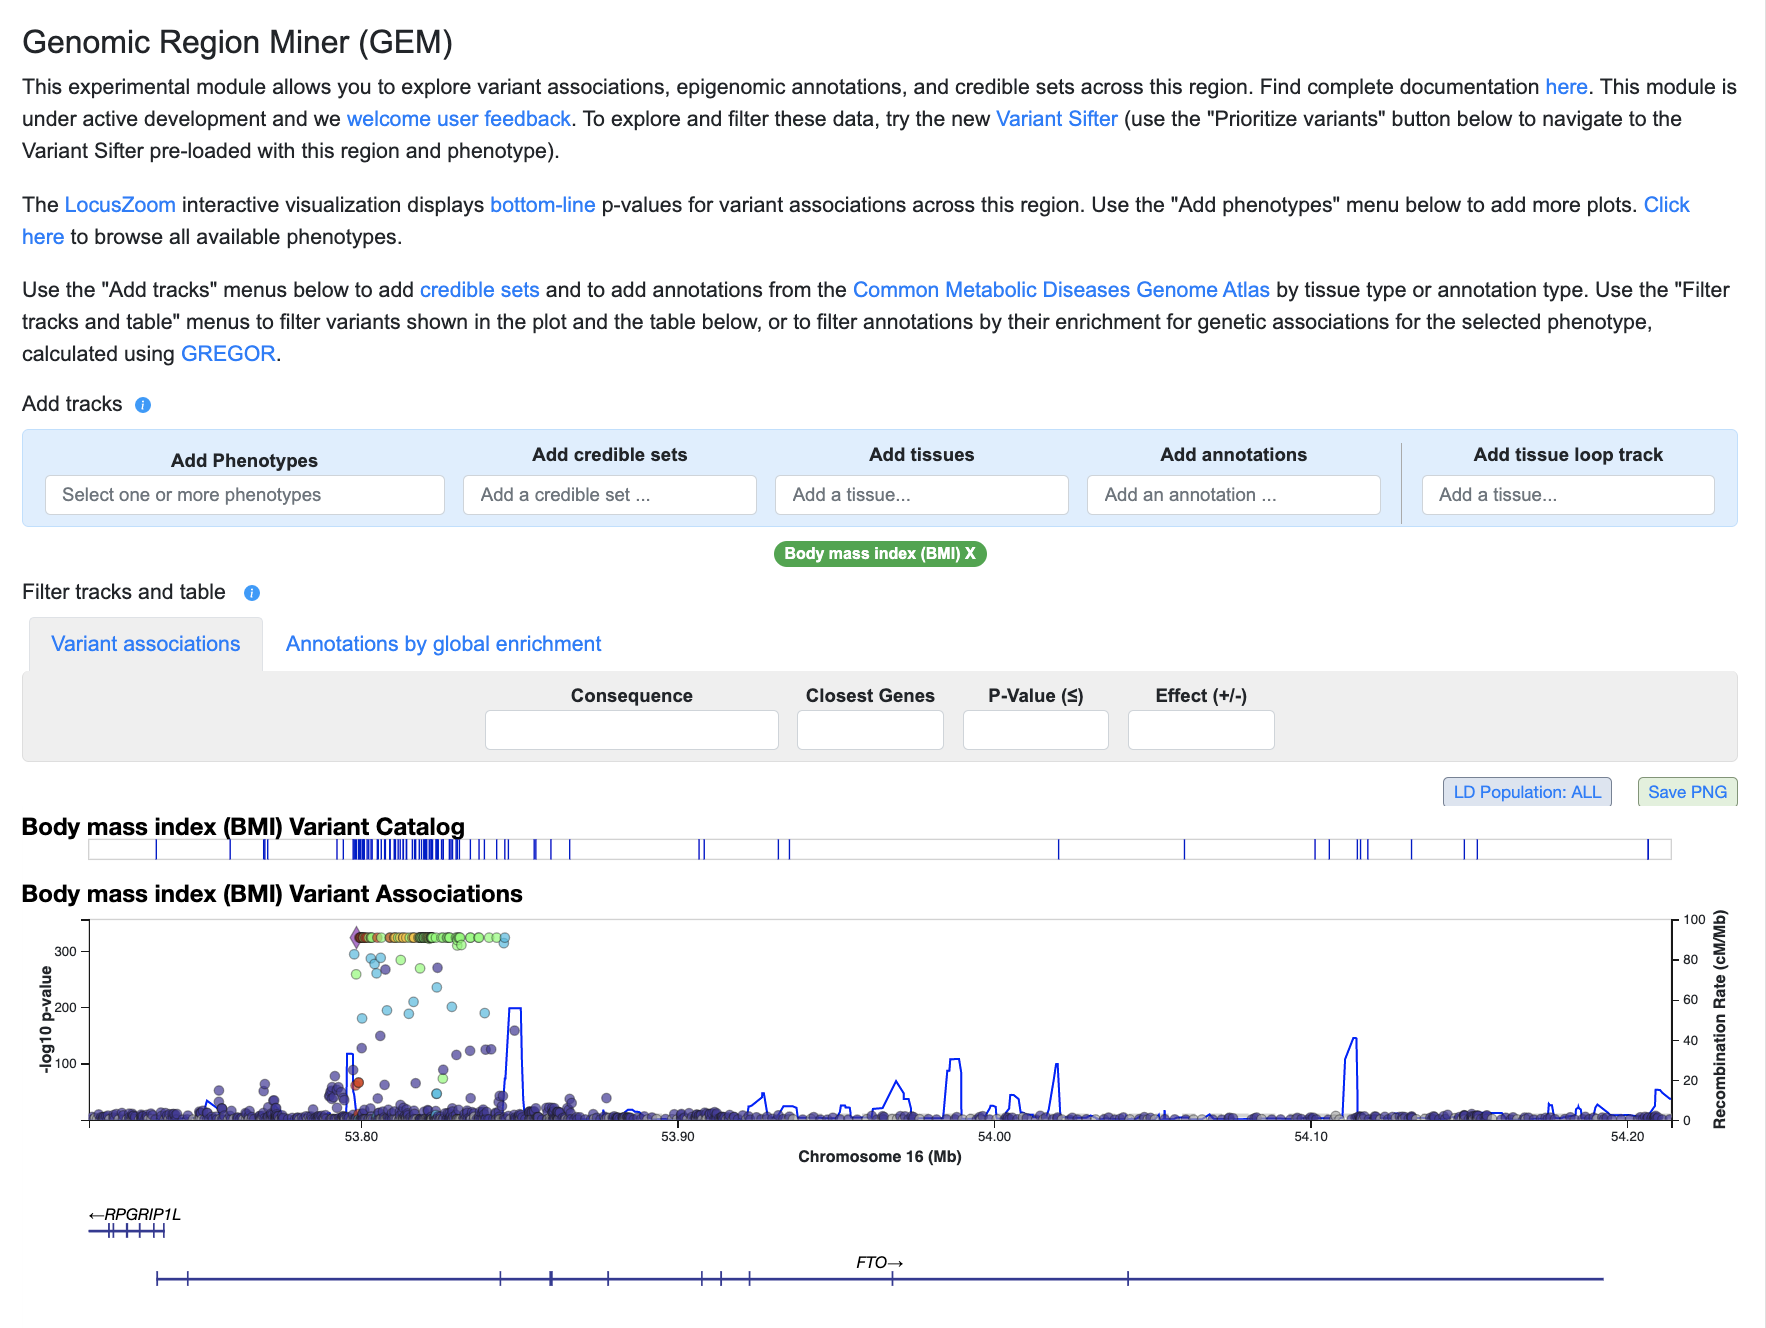
The phenotype shown by default is the one for which there is the most significant association in this region. Use the "Add phenotypes" menu above the LocusZoom plot to select and add more phenotypes:
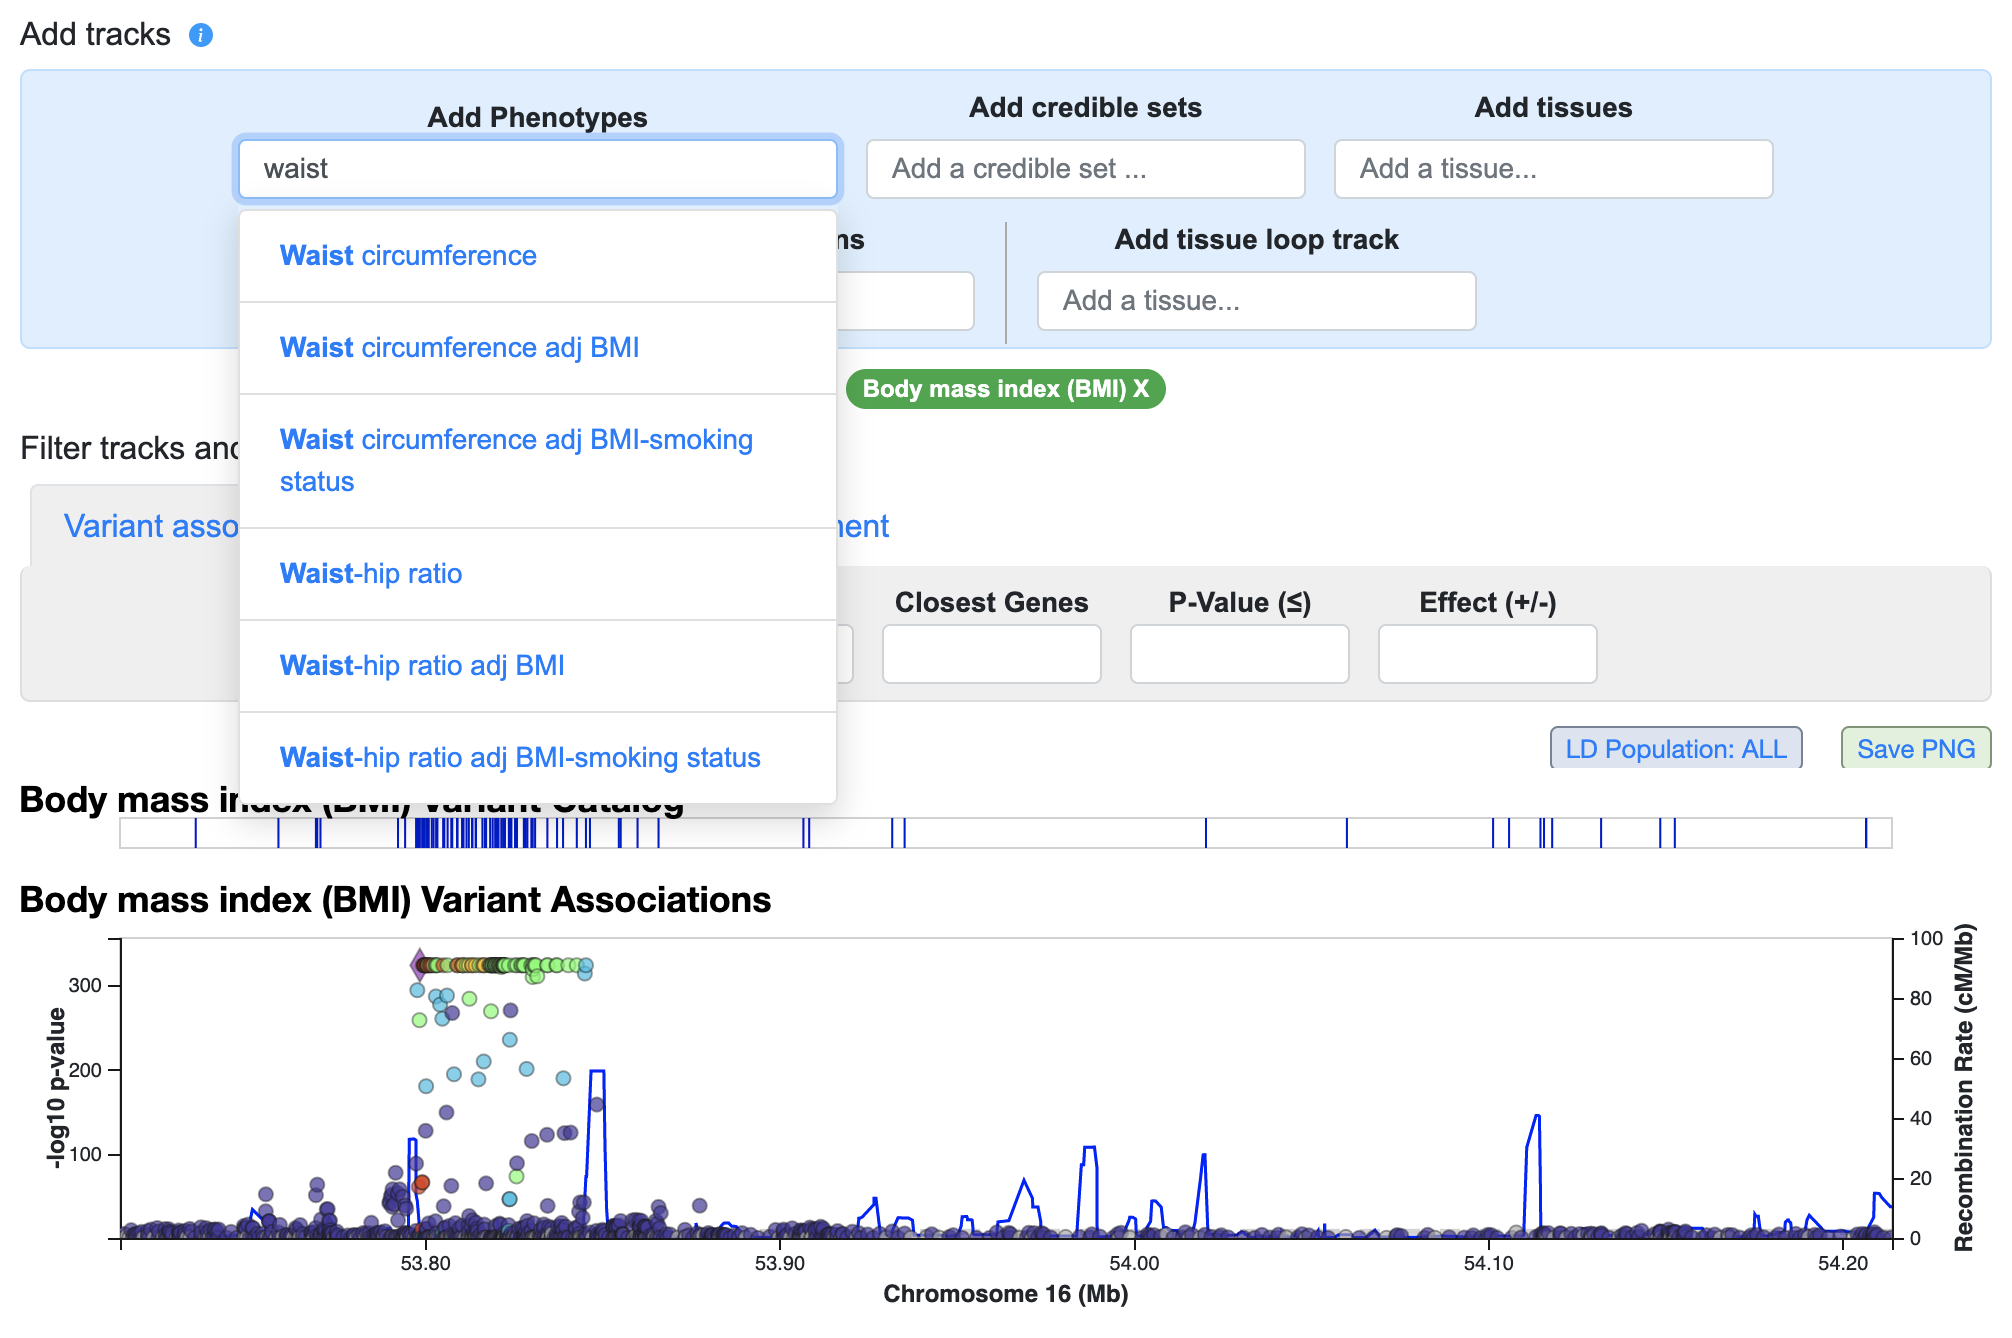
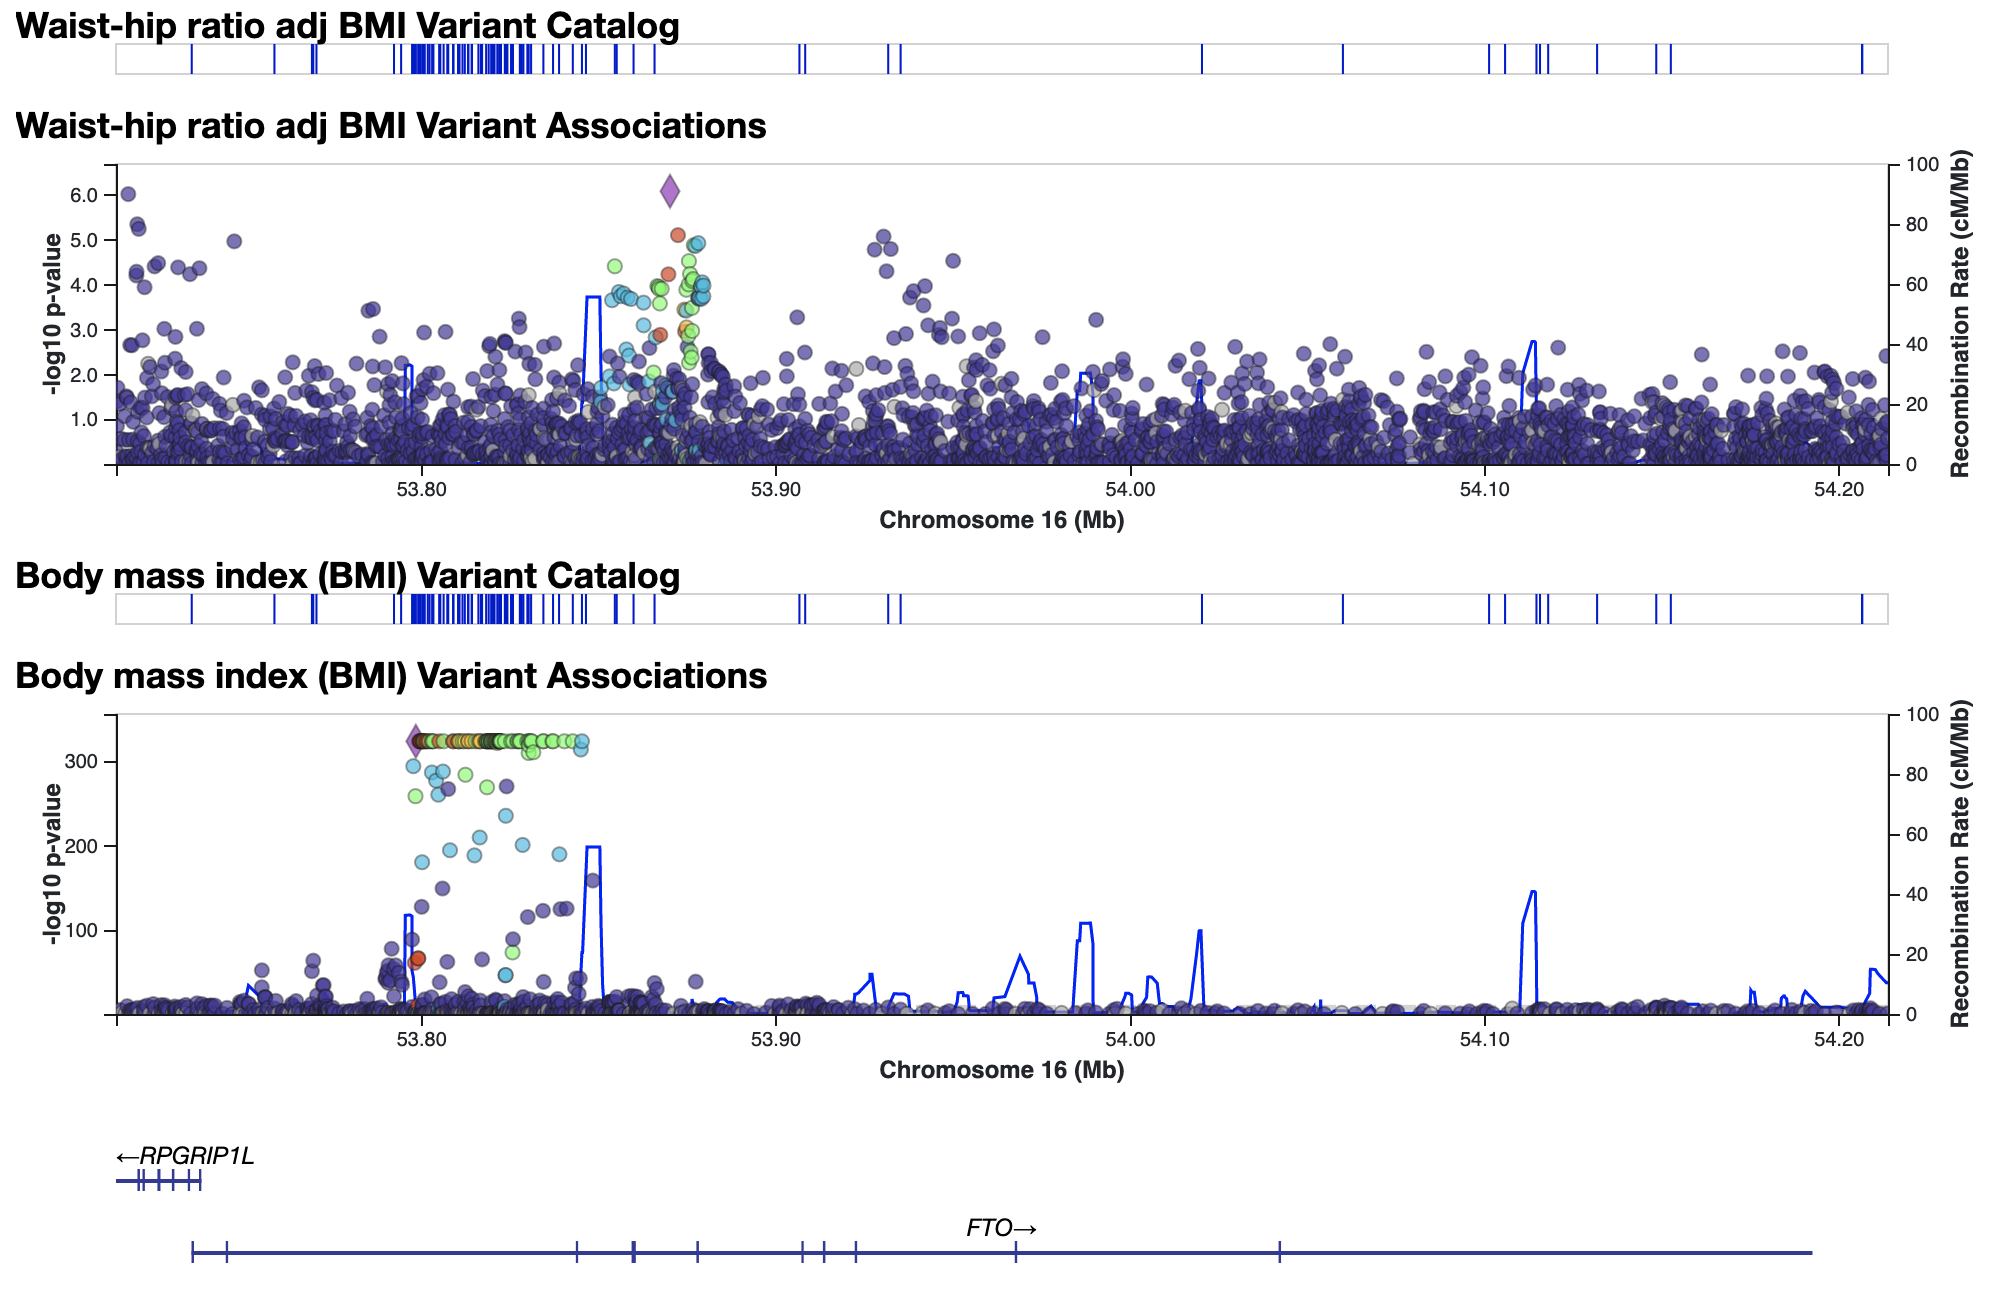
You can repeat this process to stack up as many plots as desired and get an overview of the pattern of genetic associations across the region.
3. Use the Signal Sifter to find variants with a custom pattern of genetic associations.
The Signal Sifter allows you to design queries such as: "Which variants match all of these criteria defining an insulin resistance signature?"
- a genome-wide significant association with fasting insulin adjusted for BMI
- a nominally significant association with triglyceride levels, with the same direction of effect as the fasting insulin association
- a nominally significant association with HDL cholesterol levels, with the same opposite of effect as the fasting insulin association
Navigate to the Signal Sifter from the Tools menu. Begin typing a phenotype and select the phenotype name from the menu. You can browse all available phenotypes on this page.
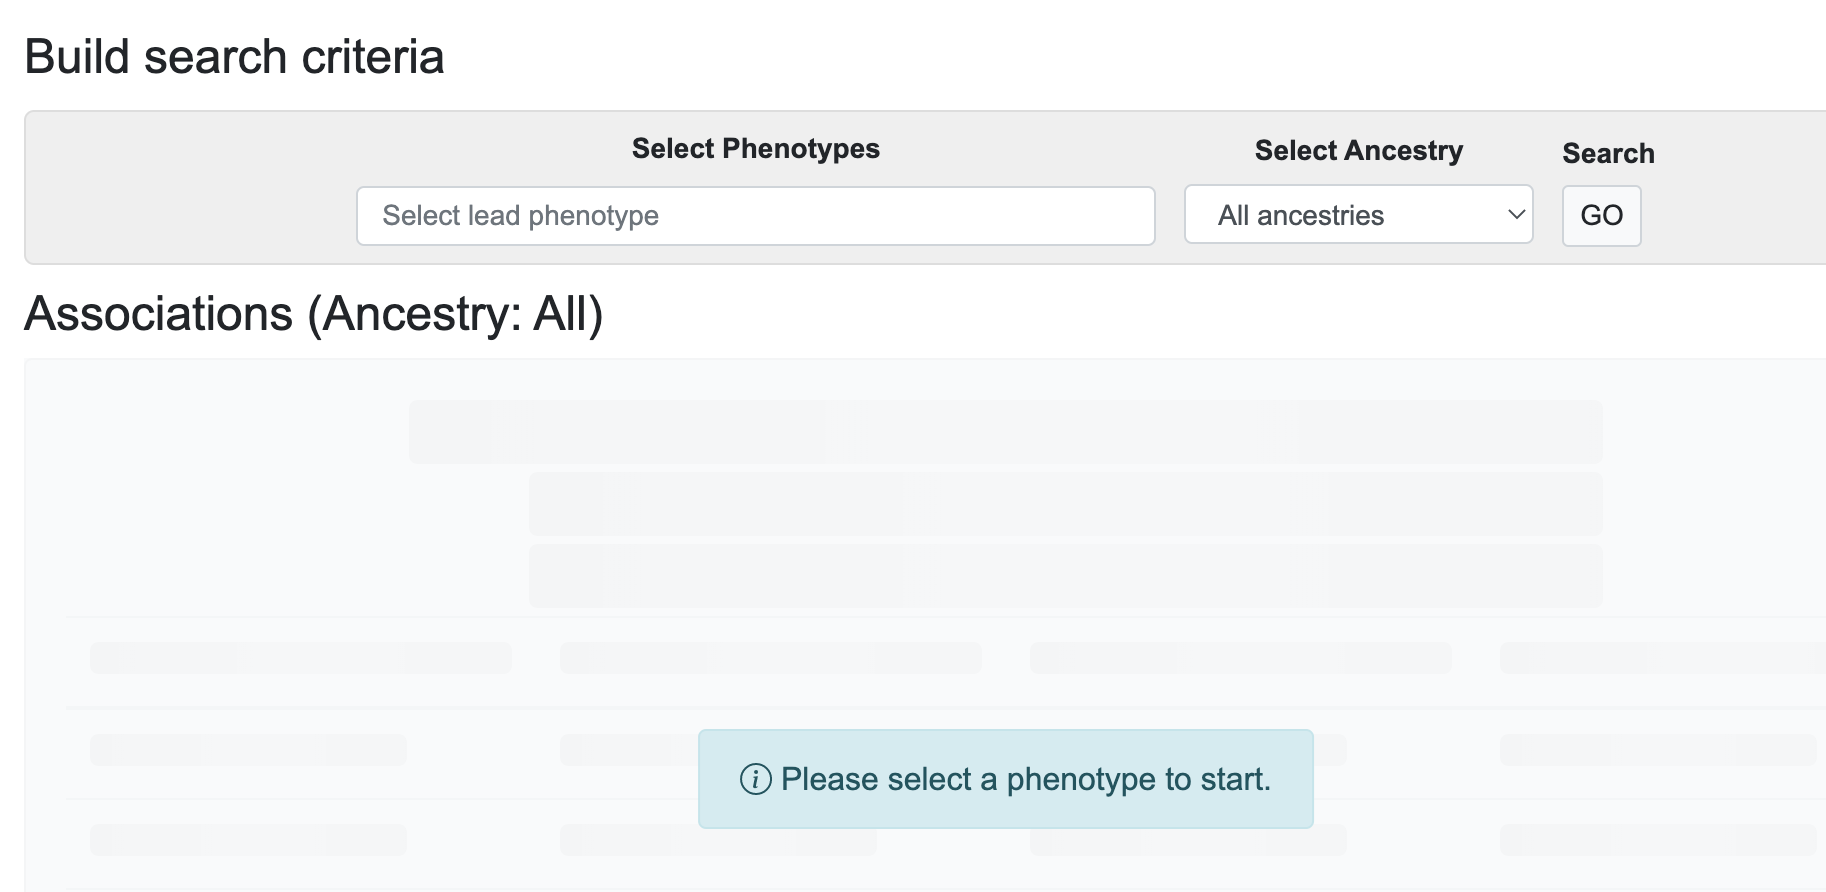
Then, add other phenotypes of interest. You can set a separate p-value threshold and filter by direction of effect for each phenotype. You can also change the ancestry at any time to view single-ancestry associations.
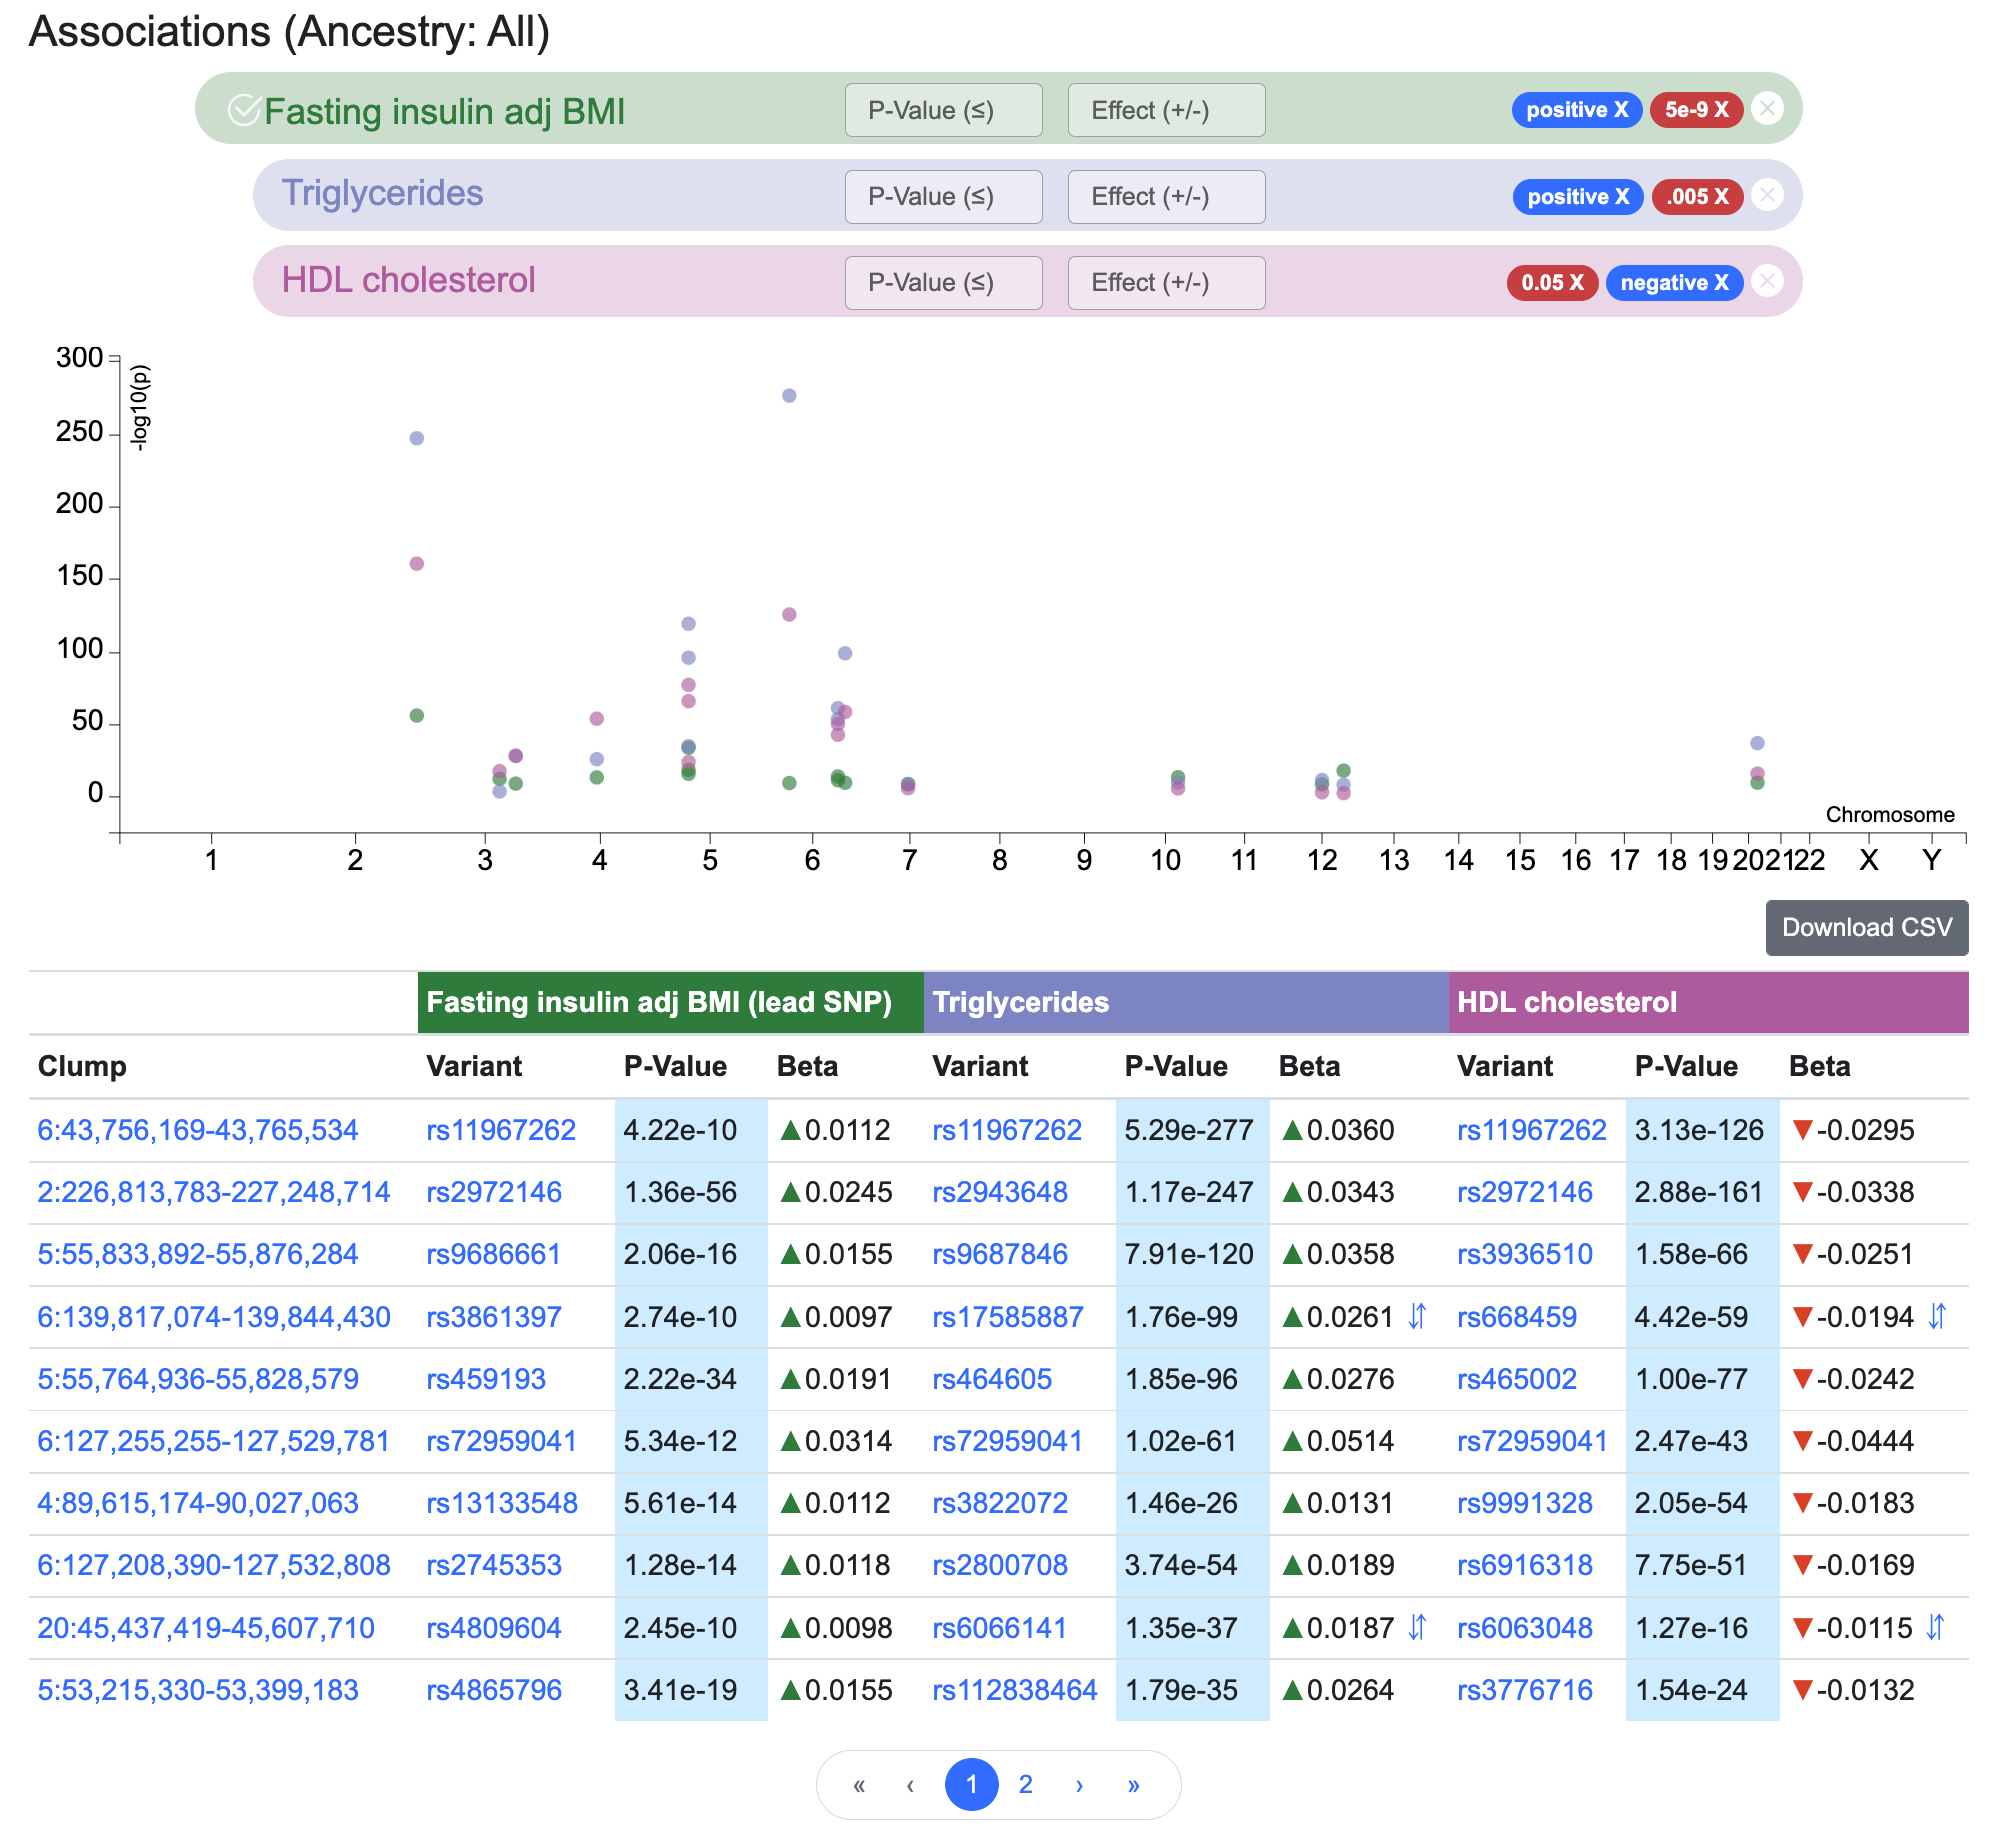
Here we've used the Signal Sifter to retrieve a set of variants potentially associated with insulin resistance.
Find out more about the Signal Sifter in our online documentation or in this brief video.
4. Use the Gene Sifter to find genes with a custom set of gene-level associations.
The Gene Sifter lets you choose a set of phenotypes and find genes with gene-level genetic associations for those phenotypes, calculated using the MAGMA algorithm. Navigate to the Gene Sifter from the KP Labs menu. Begin typing a phenotype and select the phenotype name from the menu. You can browse all available phenotypes on this page.
Continue adding phenotypes to assemble your criteria of interest. In this example, we've searched for genes that are associated with both T2D and BMI.
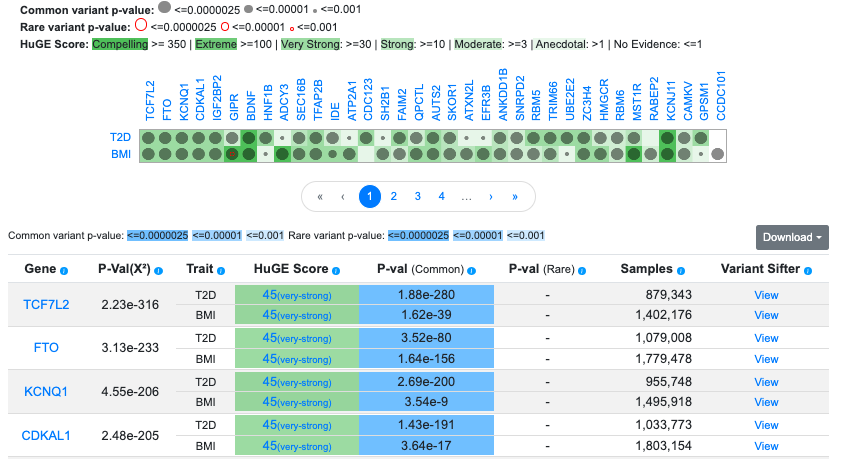
The Gene Sifter allows you to retrieve and filter genes that meet additional criteria. Find out more in our online documentation or in this brief video.
