The Gene Sifter allows you to find genes that answer custom search criteria, including common-variant and rare-variant gene-level associations, Human Genetic Evidence Calculator scores, tissue-specific gene expression levels, and presence of the gene on lists of predicted effector genes for specific traits.
Genes that act through a common pathway often have associations with the same collection of traits. Clustering genetic associations by sets of traits can reveal pathways important for disease progression or treatment (Udler et al. 2018). The Gene Sifter allows you to specify a set of traits, retrieve the list of genes associated with those traits, and then refine the list by multiple criteria.
![]()
The Gene Sifter is part of the Multi-trait analysis workflow.
The figure and video below illustrate the overall Gene Sifter workflow:

Navigate to the Gene Sifter from the Tools menu. Start typing in the Phenotype entry box and select a disease or trait from the list. You can browse all available phenotypes on this page. The Gene Sifter will retrieve the list of genes whose common variant gene-level genetic associations for that phenotype, calculated from bottom-line genetic associations using the MAGMA algorithm, have p-values ≤ 0.05. A generally accepted threshold for significance of MAGMA results is p ≤ 2.5e-6. Note that a MAGMA significant result indicates that the gene is close to a significantly associated variant, but this should not be taken to mean that the gene itself is necessarily causal for the phenotype. The MAGMA computation of gene-level association scores does not produce a direction of effect.
Select one or more additional phenotypes to search for genes that have common variant gene-level p-values ≤ 0.05 for each of the phenotypes you have selected.
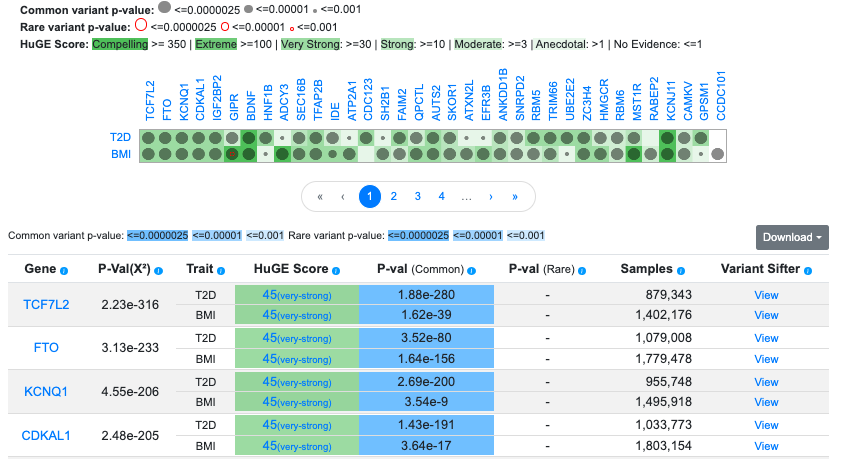
After selecting phenotypes, results are shown in a graphic and table:

In this example, we've entered the phenotypes T2D and BMI. The table and graphic include 3,308 genes that have MAGMA p-values ≤ 0.05 for both phenotypes. MAGMA p-values are shown in the P-val (common) column of the table. A caveat when interpreting Gene Sifter results is that since MAGMA associations are based solely on variant proximity and not on mechanistic links between variants and the gene, gene-level associations for different traits may be due to distinct association signals and may not support the role of a gene in multiple traits.
In the table, the P-Value(X2) column (chi-squared p-value), obtained from a meta-analysis using Fisher's method, gives a measure of overall association across the selected traits. Since it does not account for correlations among phenotypes, it should be interpreted as only an approximate measure. The Samples column refers to the number of individuals whose genotypes contributed to the bottom-line analysis of genetic associations for that phenotype. Click the information icons in the table column headers to see an explanation of the contents of each column.
By default, additional information is retrieved for each gene:
- Gene-level association scores (p-values) calculated from rare variant associations, displayed in the P-val (rare) column. The datasets and methods used to calculate these scores are documented here. Note that rare variant association scores are not available for all phenotypes.
- Human Genetic Evidence (HuGE) Calculator scores for each gene-phenotype combination. For more information on HuGE scores, see this page.
- Variant Sifter links in each row lead to the Variant Sifter pre-loaded with associations for that phenotype in the genomic region of the gene.
You can add even more information to the table using the additional options in the Build search criteria bar:

- Begin typing the name of a tissue in the Tissue-specific gene expression entry box and select a tissue to display gene expression levels in that tissue for the genes in the table. You may select multiple tissues in succession. Gene expression levels are shown in the table in the format "adipose tissue (25.24 : 2421)", where the first value (25.24 in this example) indicates the number of transcripts per million, while the second number (2421) indicates the number of samples in the dataset. Sources of the gene expression data are documented here.
- Begin typing a keyword in the Effector gene predictions entry box to find and select one or more lists of predicted effector genes. After selecting a list, the name of the list is displayed in the table for the genes that are present on that list. Mouse over the effector list name to navigate to the accompanying publication or to the effector list.

You may add multiple phenotypes, tissue-specific expression values, and effector prediction lists to the table. After adding as much information as desired, you can filter the results by HuGE score, common- or rare-variant gene-level association p-value, or gene expression TPM. By checking the boxes, you can filter the table to display only genes for which there are rare variant results, or genes that are present on effector prediction lists:

You can further configure the table using the Set p-value thresholds / Show or hide columns link (circled above). Clicking the link opens the Thresholds bar below the Filter bar:

In the P-Val (Common) or P-val (Rare) boxes, enter a p-value threshold in any of the formats 2.5e-6, 1e-5, or 0.001. This will apply blue shading to all p-values under the threshold you set. On the right, checking or un-checking P-Val (Common) or P-val (Rare) will show or hide those columns in the table.
