The Signal Sifter retrieves variants with a custom pattern of genetic associations.
Clustering genetic associations by sets of traits can reveal pathways important for disease progression or treatment (Udler et al. 2018). Use the Signal Sifter to retrieve a list of variants associated, at specified significance thresholds and/or directions of effect, with a set of traits of interest. The Signal Sifter allows you to design queries such as:
- "Which variants match all of these criteria defining an insulin resistance signature"?
- "Do variants that decrease the risk of a disease have undesired effects on other diseases or traits?"
![]()
The Signal Sifter is part of the Multi-trait analysis workflow.
The figure and video below illustrate the overall Signal Sifter workflow:

Navigate to the Signal Sifter from the Tools menu.

Begin typing a phenotype and select the phenotype name from the menu. You can browse all available phenotypes on this page.
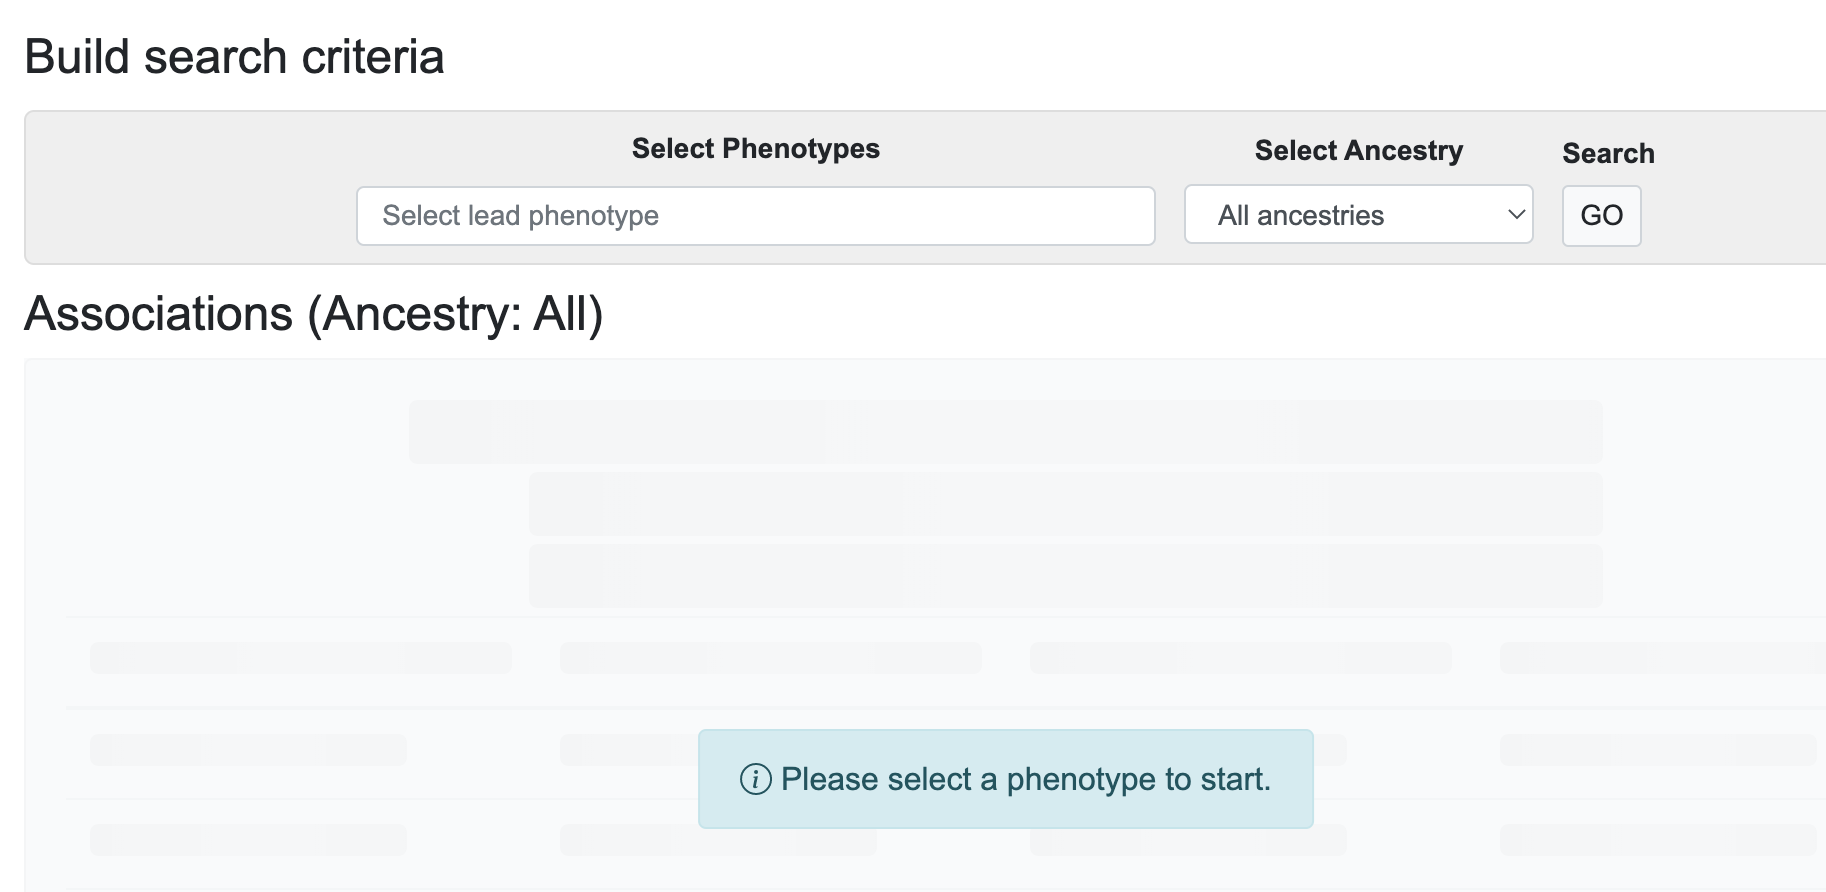
Select a phenotype and, optionally, an ancestry to start:

Note that associations may not be available for a given ancestry-phenotype combination. The graphic and table display LD clumps (sets of genetically linked variants) where the top variant has a genome-wide significant association (p-value ≤ 5e-8) with the selected phenotype. The associations shown are derived from "bottom-line" integrative analysis.

Next, select one or more additional phenotypes to query whether the variants within the clumps that you retrieved for the first phenotype are also significantly associated with those additional phenotypes. The Signal Sifter retrieves the variant within the clump that is most significantly associated with the additional phenotype(s).

In the example above, we've entered Fasting insulin adj BMI as the first phenotype. We see that the top variant is rs780093 and it's within the clump that spans the region 27,055,853-28,113,912 on chromosome 2. We then entered Triglycerides as the second phenotype. The Signal Sifter results show us that rs13391837, which is in LD with rs780093, is the variant in the clump that's most significantly associated with triglyceride levels.
In contrast to a formal colocalization analysis, which would find a single SNP associated with both traits of interest, the Signal Sifter considers all variants in an LD clump. If the top SNP for the second phenotype has a direction of effect for the first phenotype that is opposite to that of the lead SNP for that phenotype, then the Signal Sifter flips the alleles. Again using the example above, rs13234269 (in the 7th row of the table) has a negative direction of effect for fasting insulin adjusted for BMI. The top SNP in the rs13234269 clump for triglyceride association is rs972283, whose association for fasting insulin adjusted for BMI has a positive direction of effect. In cases like this, the Signal Sifter flips the alleles for the secondary variant in order to make its direction of effect consistent with that of the lead variant. The double arrow icon in the results table indicates that this flipping has been done.
At any time while using the Signal Sifter, you can filter the results per phenotype by setting a p-value threshold or choosing + or - direction of effect.

To filter the results, enter a p-value threshold into the p-value box, and/or select positive or negative direction of effect. Press "Return" to set the filter. The filters you have entered are shown on the right for each phenotype.
By clicking the Download CSV button above the table, you can download all results as a file in comma-separated values format.
When interpreting results from the Signal Sifter, remember that it does not perform formal colocalization analysis: signals for different traits found within one clump could be due to distinct, independent causal variants.
