Overview
Genome-wide association studies (GWAS) detect genetic variation between individuals and test for statistically significant correlation of disease status or magnitude of a trait with the presence of a variant (also termed a single-nucleotide polymorphism, or SNP). Identifying disease-associated SNPs can reveal genes and pathways involved in the biological mechanisms underlying the disease. This understanding could in turn lead to more accurate prediction of risk and to better strategies for disease prevention and treatment.
At the Knowledge Portal Network, we aggregate and analyze genetic association results for a wide range of diseases and traits (over 1,100 phenotypes to date; browse them here). For any given disease, a large number of individual genetic association datasets may have been generated. To make these results more interpretable, we meta-analyze all datasets for each phenotype, using a method that we term "bottom-line integrative analysis" (described in detail here). Bottom-line analysis can both 1) eliminate artifactual associations that are not supported across multiple datasets and 2) identify novel associations that do not rise to genome-wide significance (p-value ≤ 5e-8) in individual studies (Figure 1).
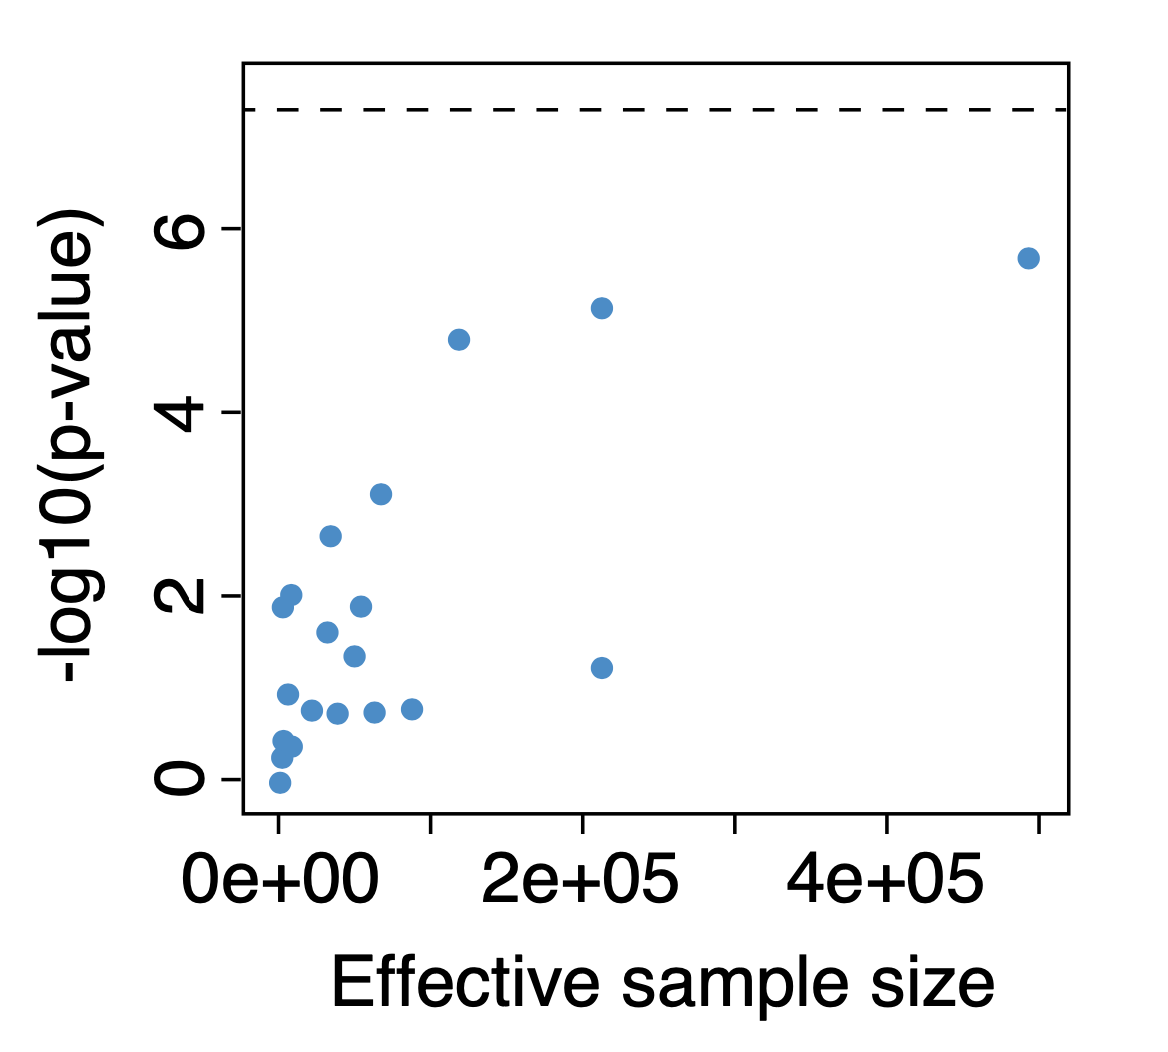
Figure 1. Individual dataset-level associations for an example variant that rose to genome-wide significance in the bottom-line analysis. Each point represents the association of the variant with a specific phenotype, as determined in a single study. Significance of association (y-axis) is plotted against dataset sample size (x-axis). While the variant has been found to be nominally associated with the phenotype in multiple studies, and significance is seen to increase with increasing sample size, the association does not reach genome-wide significance (dotted line) in any single study; however, in the bottom-line analysis the association does reach genome-wide significance.
Here we provide summary statistic files of bottom-line associations for all phenotypes in our knowledgebase. Each file includes associations for one phenotype-ancestry combimation. These files will be updated with each production release of the Knowledge Portals, typically three times per year.
Data format
Bottom-line association statistics are provided as plain text files with the following columns:
- varId: variant ID, in the format chromosome:position:reference allele:alternate allele
- chromosome: chromosome on which the variant is located
- position: chromosomal position (GRCh37 (hg19) genome build) of the variant
- reference: reference allele
- alt: alternate allele
- pValue: p-value of the association
- beta: the effect size for the association*
- stdErr: standard error of the association
- n: effective sample size
*Effect size is expressed as log(odds ratio) for binary traits and beta coefficient for continuous traits. Odds ratios greater than 1 indicate that a variant is associated with increased disease risk, while ratios less than 1 indicate association with decreased risk. Beta coefficients are measured in units of population standard deviations; for example, a beta of 0.1 means that variant carriers have 0.1 standard deviation higher values than the mean.
Metadata
Phenotype
This page lists all phenotypes for which bottom-line genetic associations are available. Each phenotype has:
- a descriptive name, based on the descriptions published by authors of GWAS papers (e.g., "Myocardial infarction")
- an ID, the text string used to identify the phenotype internally in the Knowledge Portals (e.g., "MI")
- a phenotype group, broad classifications of phenotypes that are curated at the Knowledge Portals (e.g., "CARDIOVASCULAR")
- an indication of whether the phenotype is dichotomous (binary; indicated by '1' in the Dichotomous column) or continuous (quantitative; indicated by '0' in the Dichotomous column).
Ancestry
We perform bottom-line meta-analysis both within and across ancestries to generate single-ancestry and trans-ancestry results. The ancestries currently represented are:
- African American or Afro-Caribbean
- African iunspecified
- East Asian
- European
- Greater Middle Eastern (Middle Eastern, North African, or Persian)
- Hispanic or Latin American
- South Asian
- Sub-Saharan African
Input datasets for bottom-line analysis
You can see which individual datasets have gone into the bottom-line analysis for a specific phenotype on the Phenotype pages of the Association to Function Knowledge Portal (A2FKP). To navigate to a Phenotype page, enter part or all of the phenotype descriptive name into the search box on the home page of the A2FKP and select the desired phenotype. On the Phenotype page, scroll down to the section that reads "Datasets with genetic associations for [phenotype]" to see the list of datasets that were meta-analyzed to generate the bottom-line summary statistics for that phenotype.