We've just updated the Knowledge Portals to bring you quicker and easier access to the most important results for a gene, region, or trait of interest. And our experimental KP Labs space has several new tools to play with! Today's post will focus on the changes in the core parts of the Knowledge Portals, while tomorrow's will feature the new tools.
We've now implemented clumping by linkage disequilibrium (LD), which means that instead of paging through long lists of associated variants in a locus, you can immediately see the most significant association in a group of genetically linked variants (a "clump"). A new table on the Region page (see an example) lists the lead variant for each clump in that region:
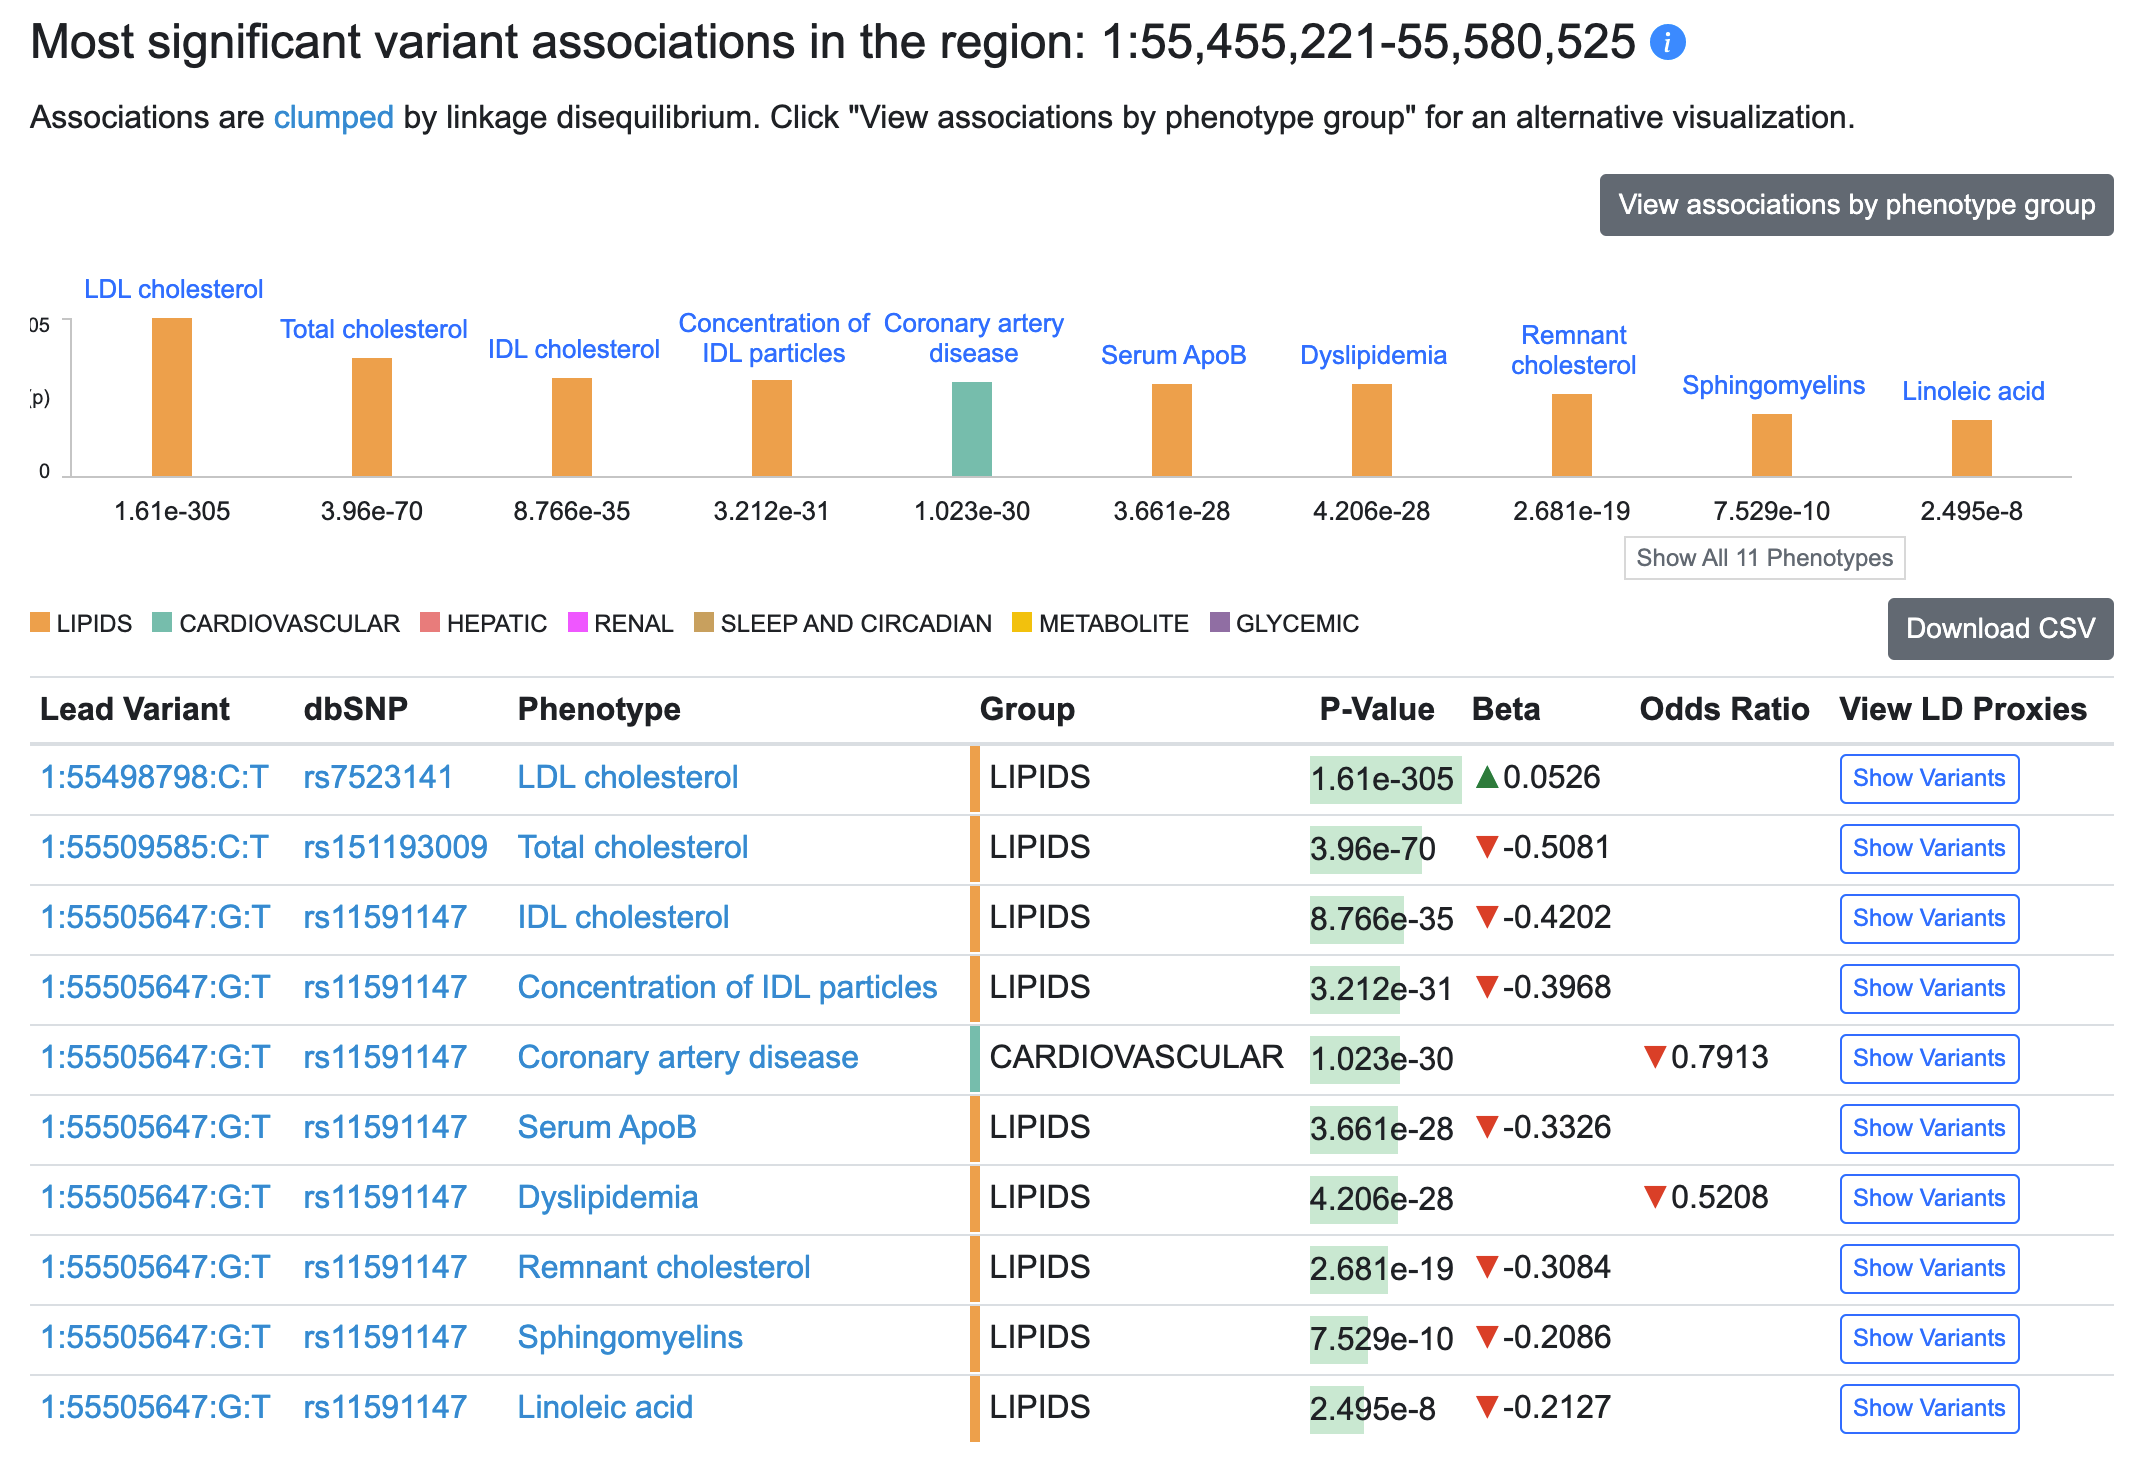
You still have access to all associations: the "Show variants" button in the table illustrated above displays associations for all variants in that clump, and lower down on the Region page, the Variants in region table displays all associations for a selected phenotype.
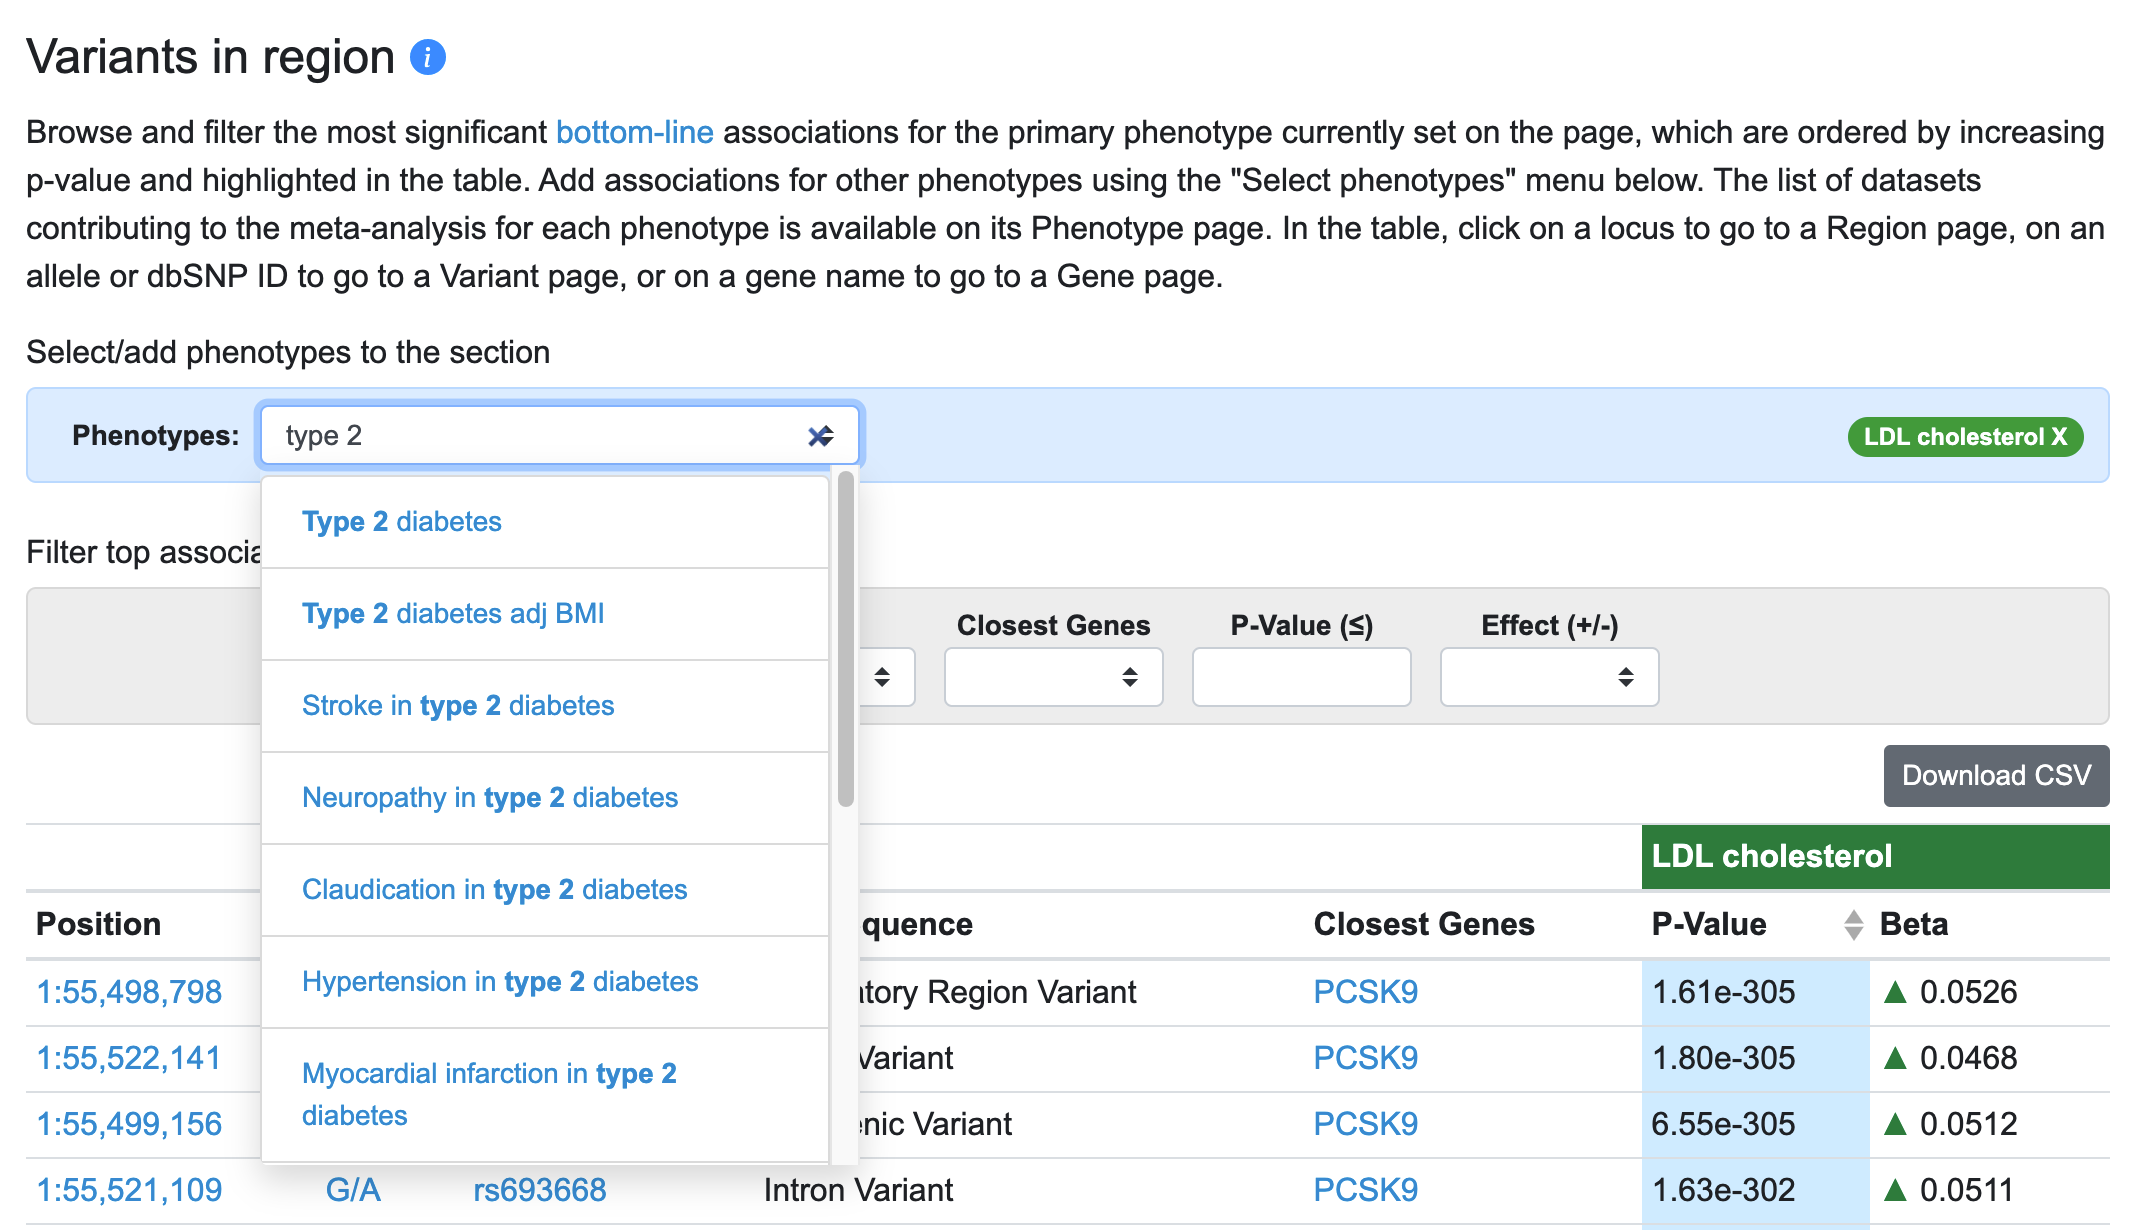
Another major innovation on the Region page is that you can now view results for multiple phenotypes in the Variants in region table and in LocusZoom. The default phenotype shown is the one with the most significant association in the region (in the example below, LDL cholesterol). To add phenotypes, begin typing in the entry box and select a phenotype of interest.
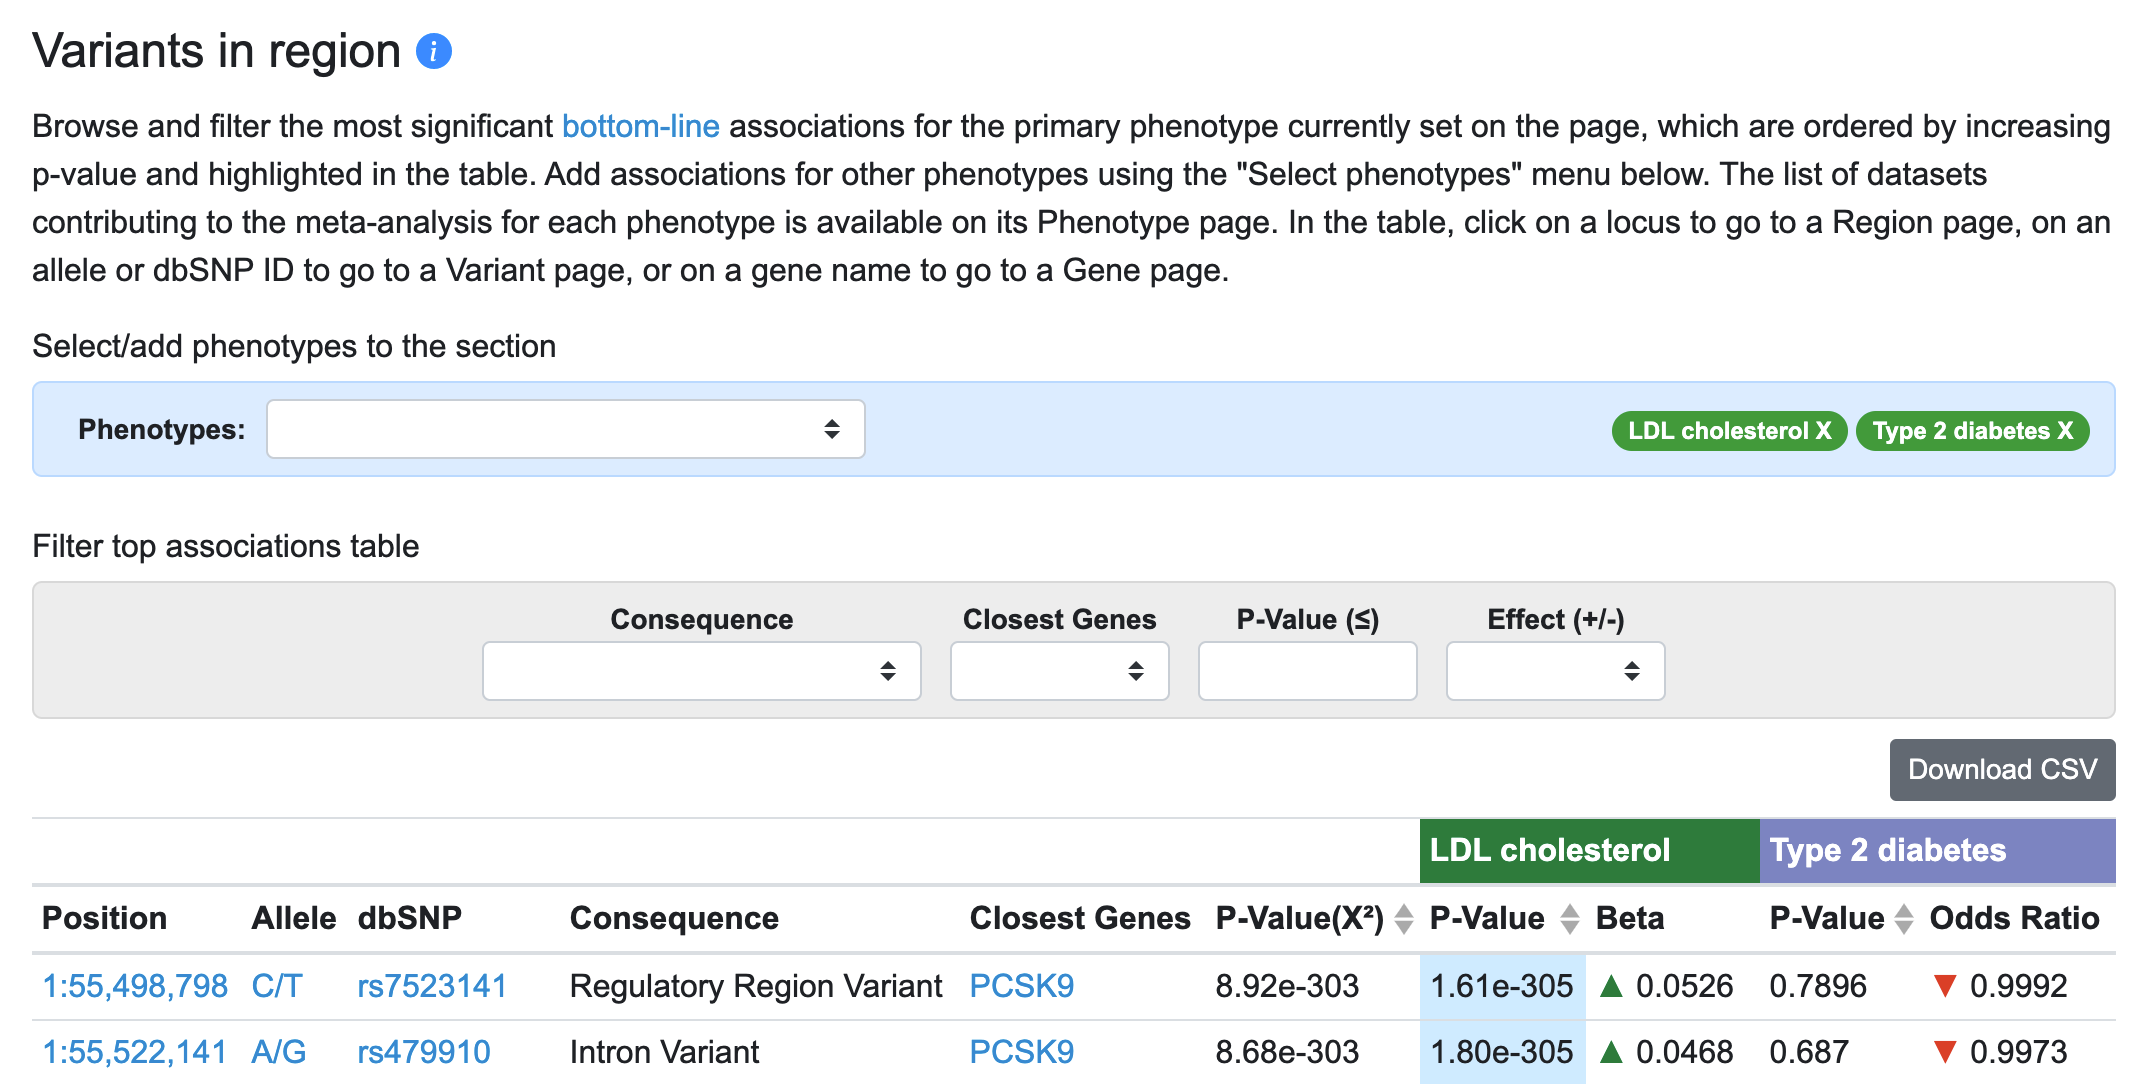
Now, for each variant in the table associated with the primary phenotype (LDL cholesterol), associations of that variant with the added phenotype (type 2 diabetes) are displayed.
LocusZoom plots for both phenotypes are stacked below:
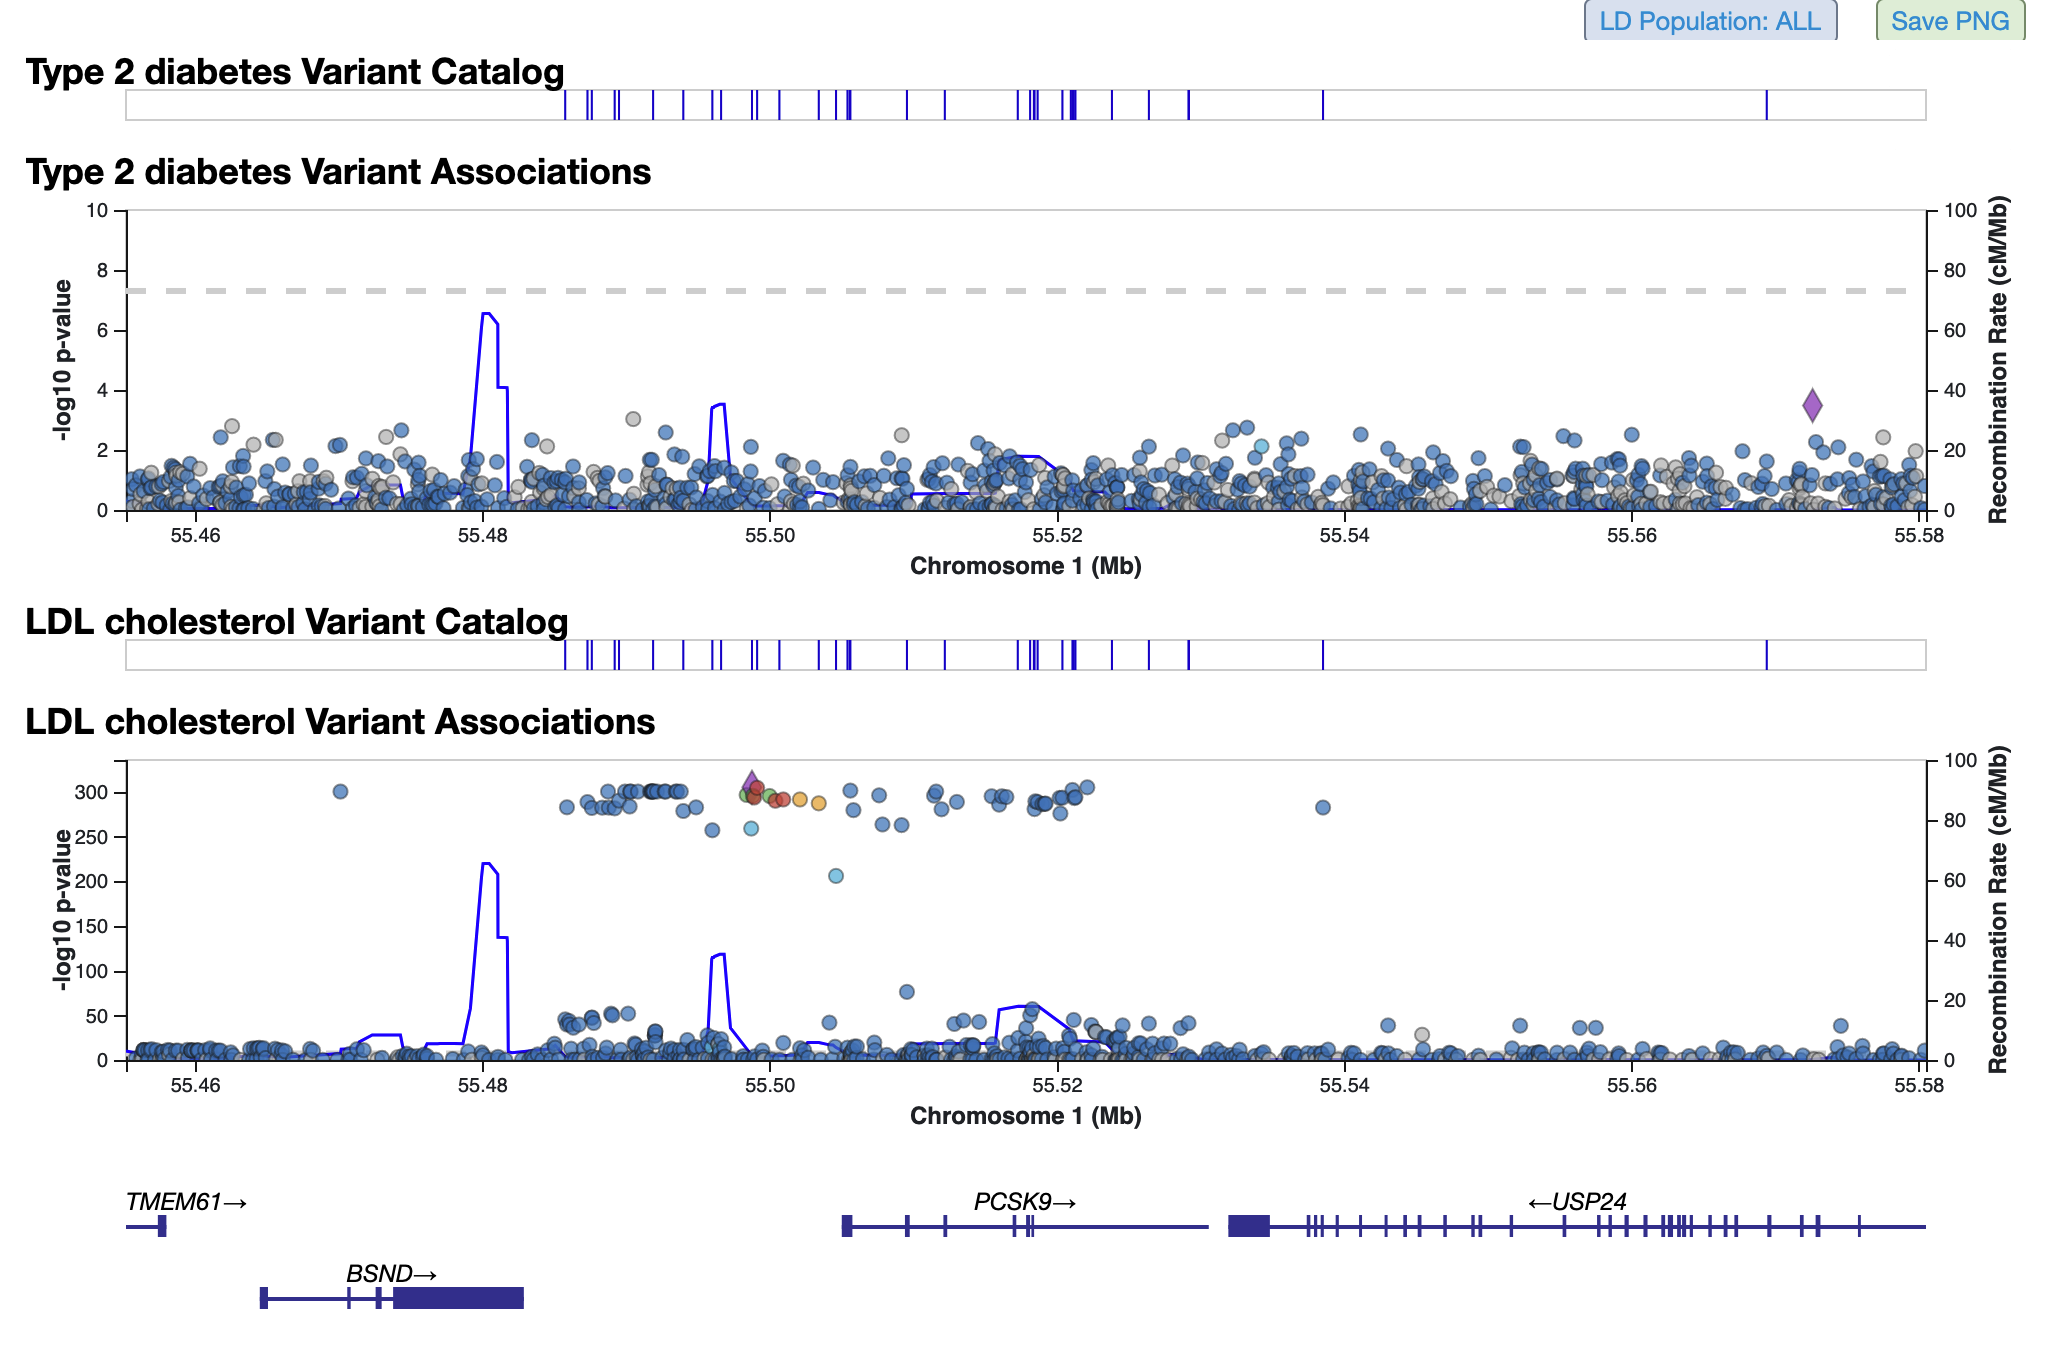
You can repeat this procedure to add multiple phenotypes to the table and plots. An alternative way to add phenotypes is to hover over any phenotype name on the page and click the option "Add this phenotype below".
To change the primary phenotype for the page, which determines the list of variants shown in the Variants in region table, simply click the option "Set below to this phenotype" when hovering over a phenotype name.
Also on the Region page, a new menu organization in the Genomic Region Miner (GEM) makes it much more straightforward to view epigenomic results for a specific tissue or data type. The "Add tissue" menu now allows you to select a major tissue (e.g., "Pancreas"), while the "Add annotation" menu allows you to select a data type (e.g., "Accessible chromatin") to filter your view of epigenomic annotations for the region.
Finally, we now offer programatic access to all of the information in the Knowledge Portals via the Lunaris app, which replaces the APIs that were formerly available. A Lunaris documentation page, available under Data in the upper menu on all Portal pages, explains the data types available via Lunaris and how to access the tool.
We hope these updates make your experience using the Portals more straightforward and more informative. As always, we are very interested in your feedback.