Below are brief tutorials illustrating how to explore results using each of these modules:
- Differential Expression View
- Genome-wide APOL1 Correlations View
- Differential Co-expression View
- Interactive App
Differential Expression View
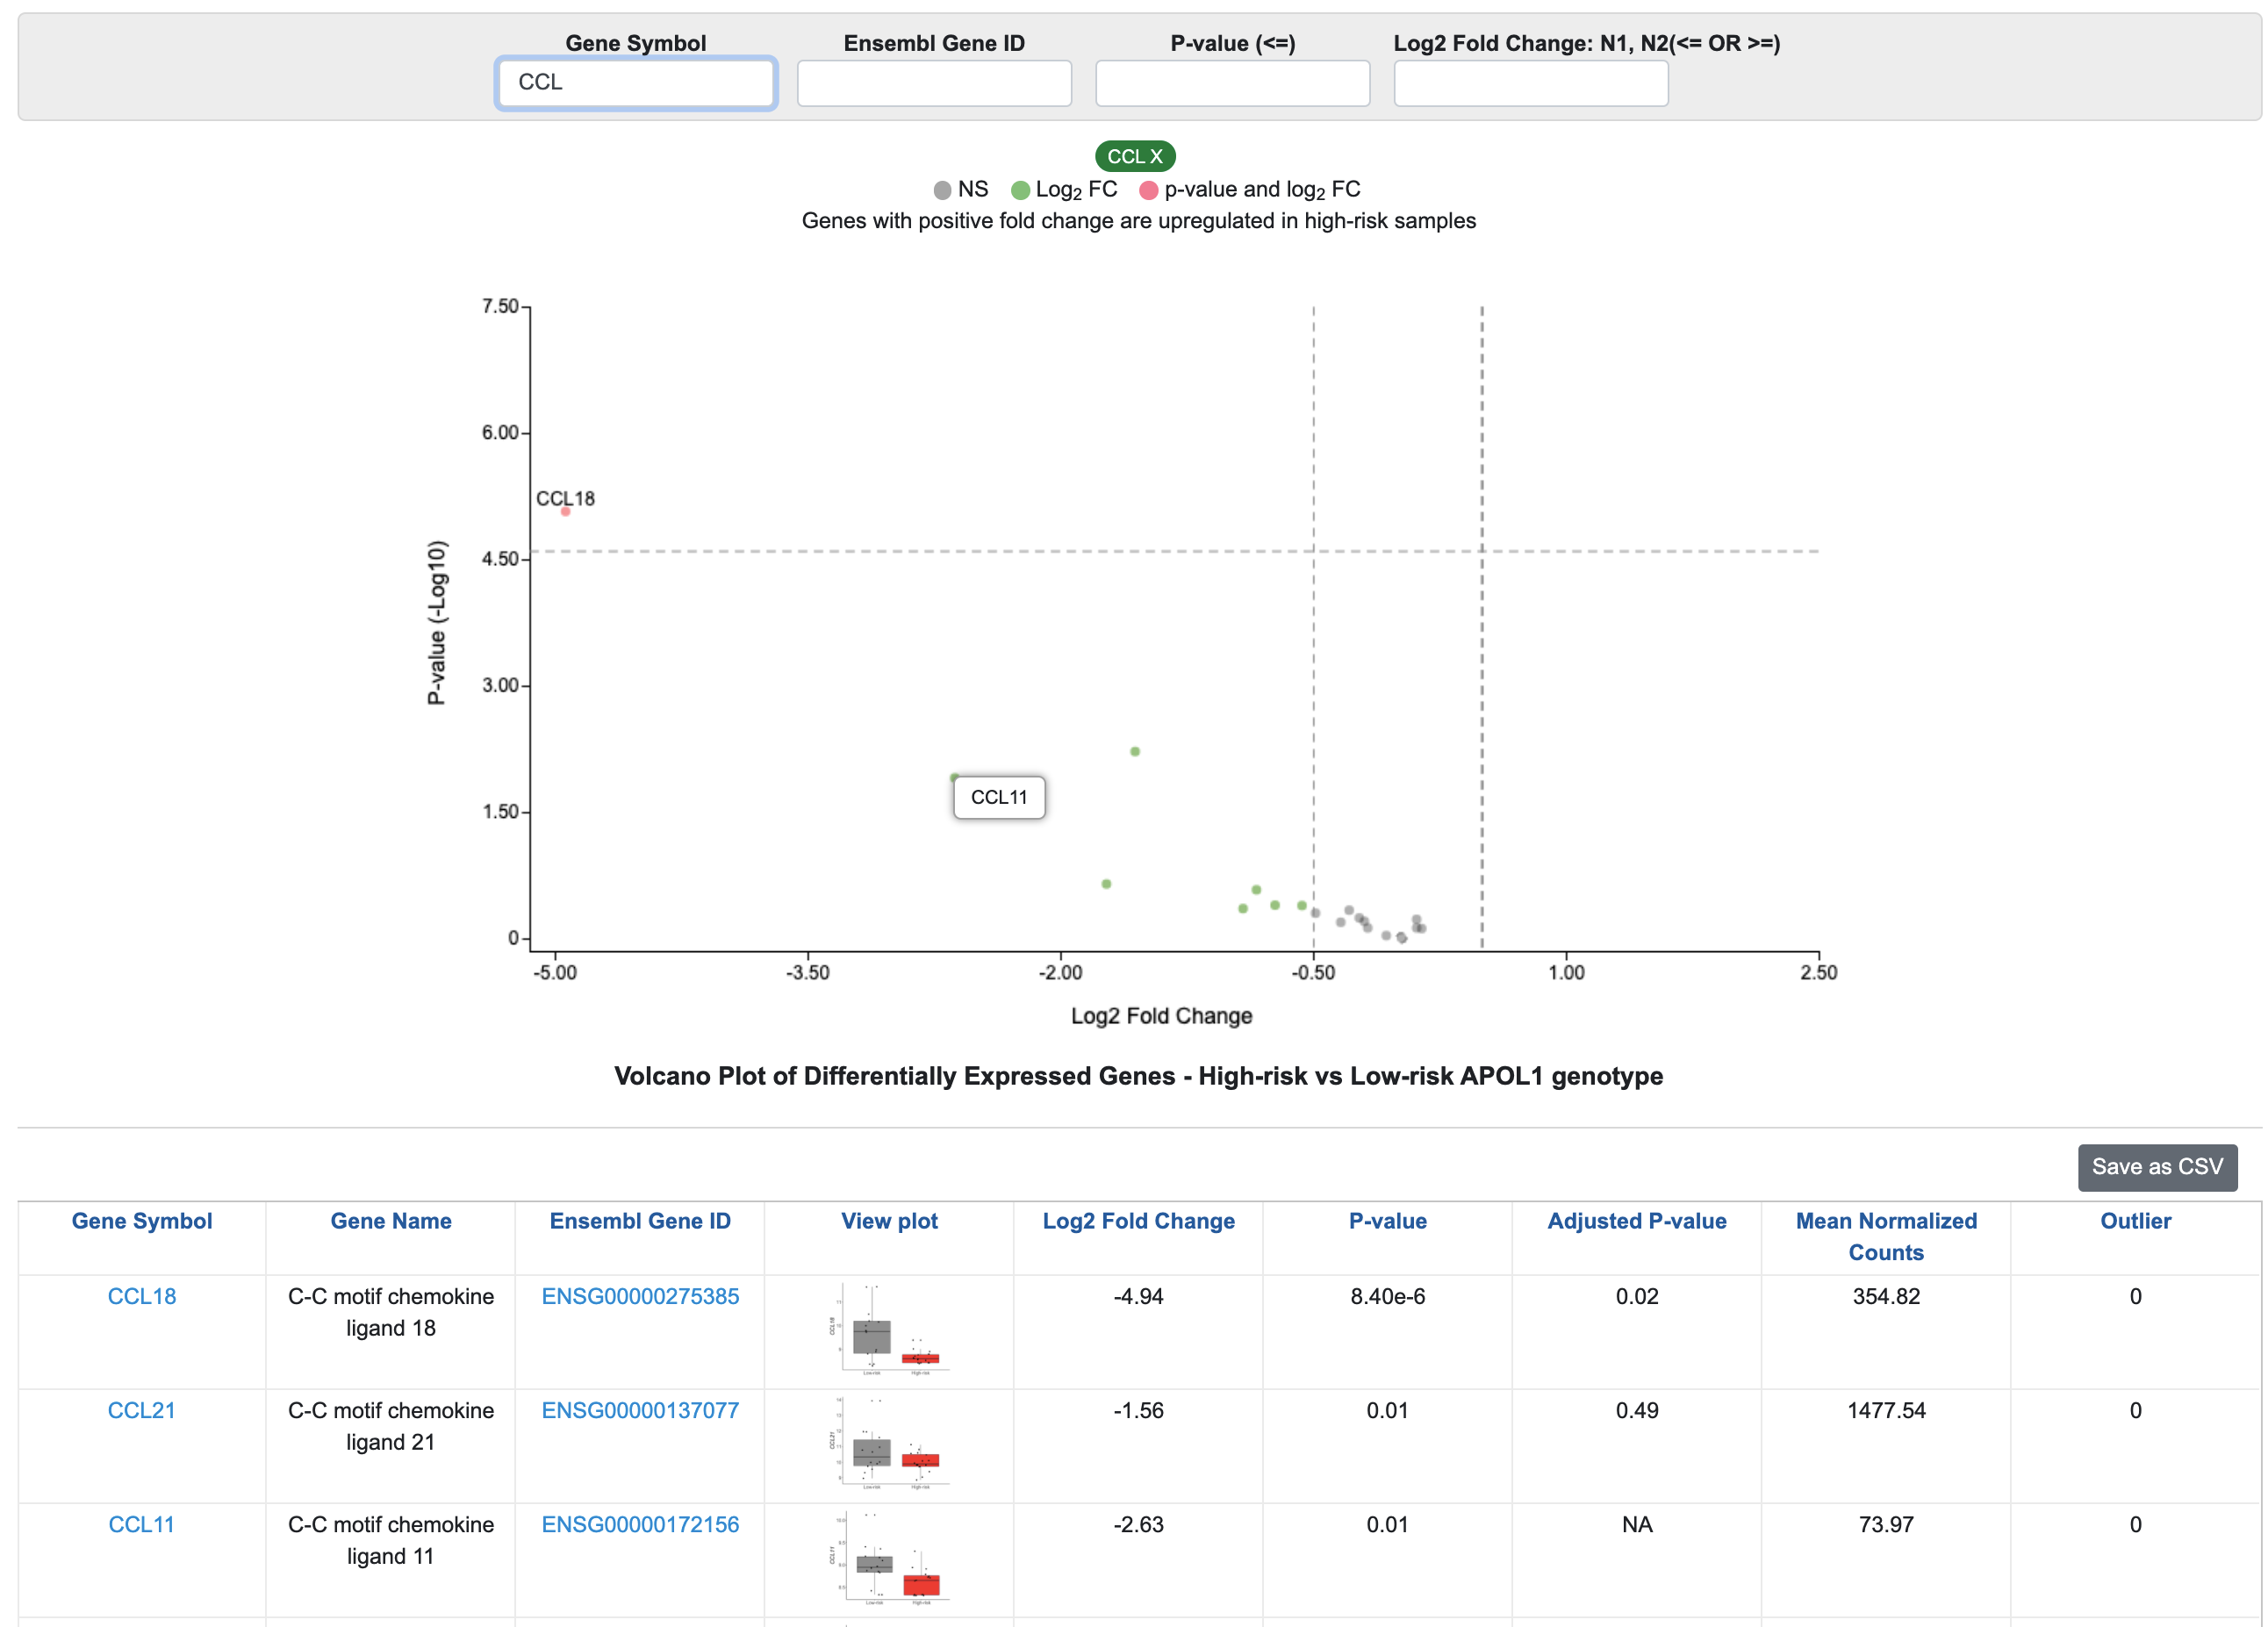
The full differential expression analysis (DESeq2) results are included in this view. The table of results can be sorted by clicking column headers and filtered by Gene Symbol, Ensembl ID, P-value (unadjusted), and Log2 Fold Change.
To screen a specific gene or family of genes, use the Gene Symbol or Ensembl Gene ID filtering options. For example, if you’re interested in chemokine ligands, you can type “CCL” in Gene Symbol, and the results will be filtered to genes with “CCL” in their gene symbol. The volcano plot will only include selected genes, and you can click on a point to reveal the gene symbol. We can see from this figure that there are multiple chemokine ligands with higher expression in low-risk FSGS samples.
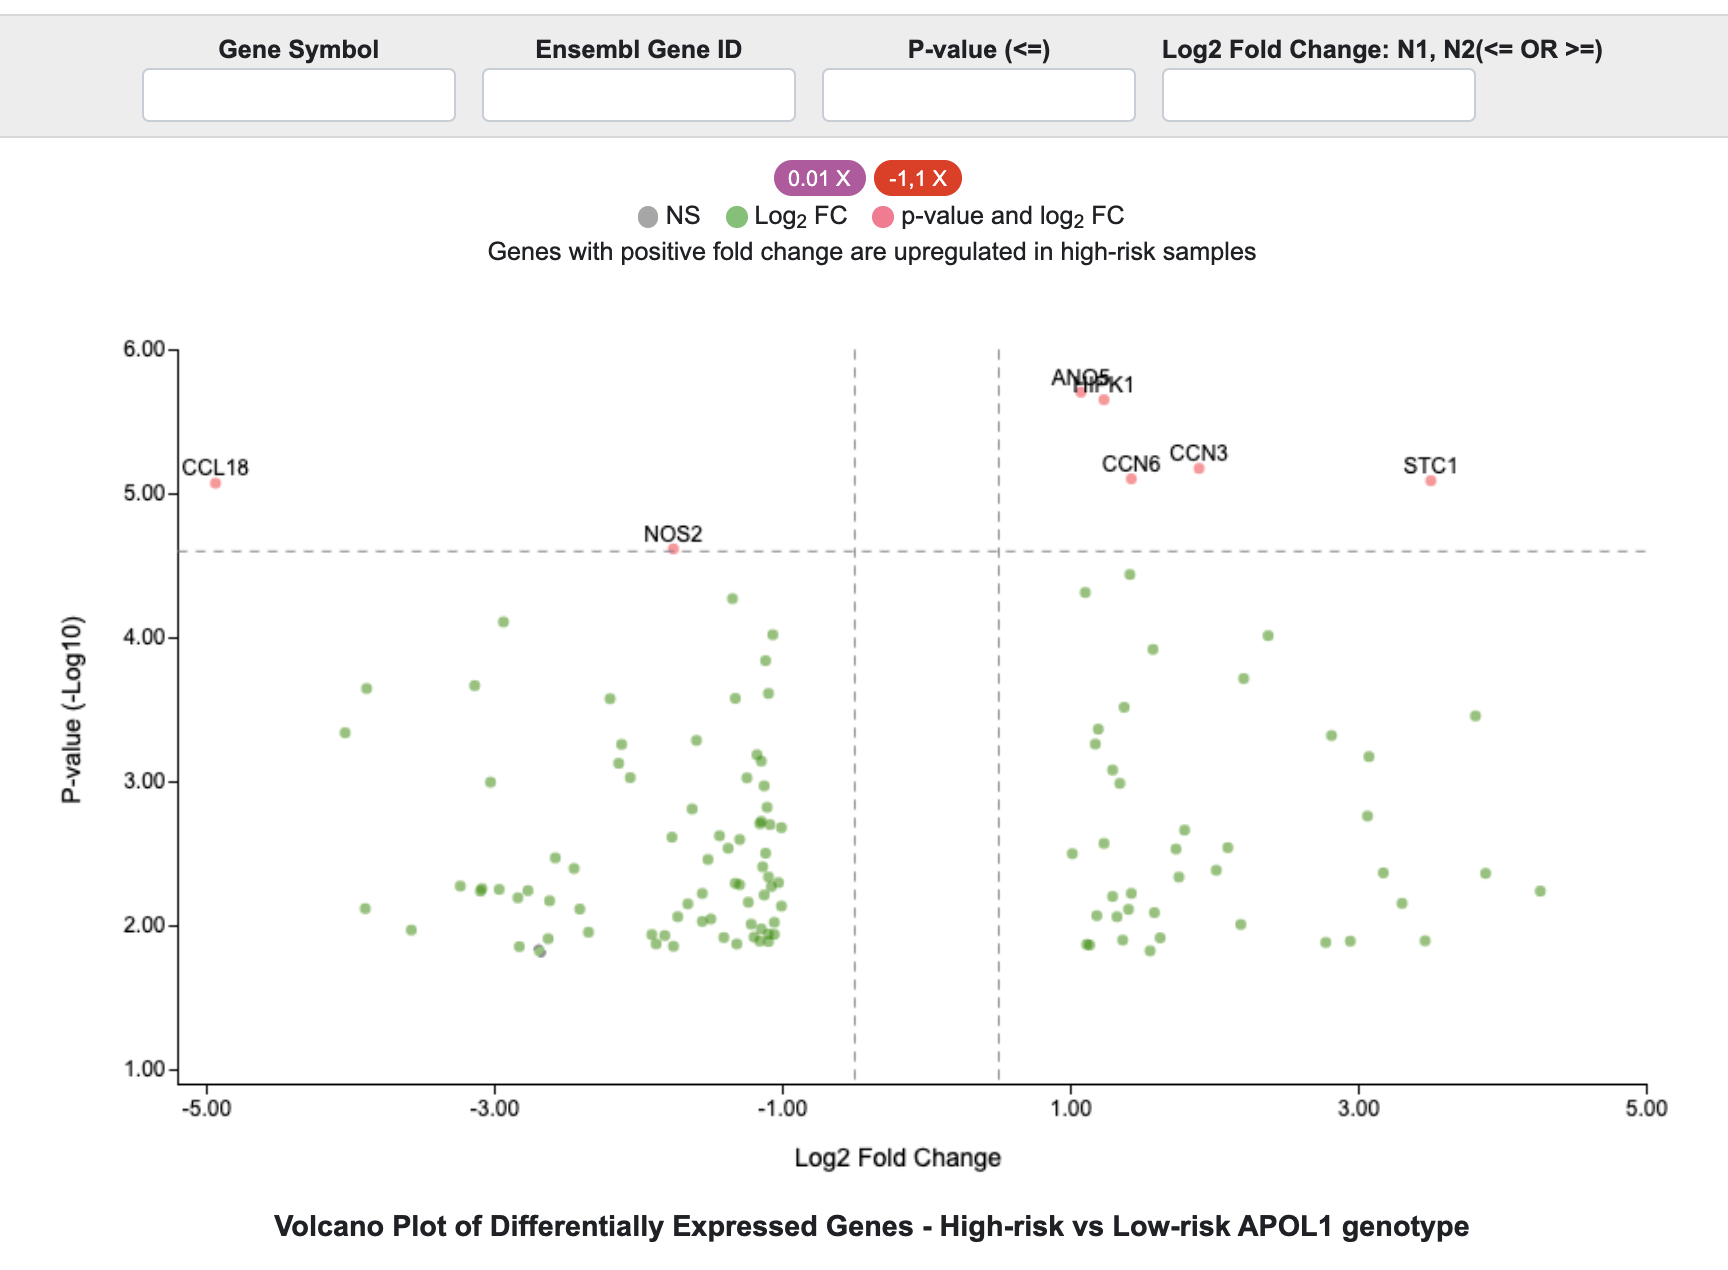
In the example below, the filters were used to identify genes with an unadjusted p-value < 0.01 and absolute fold change > 1.
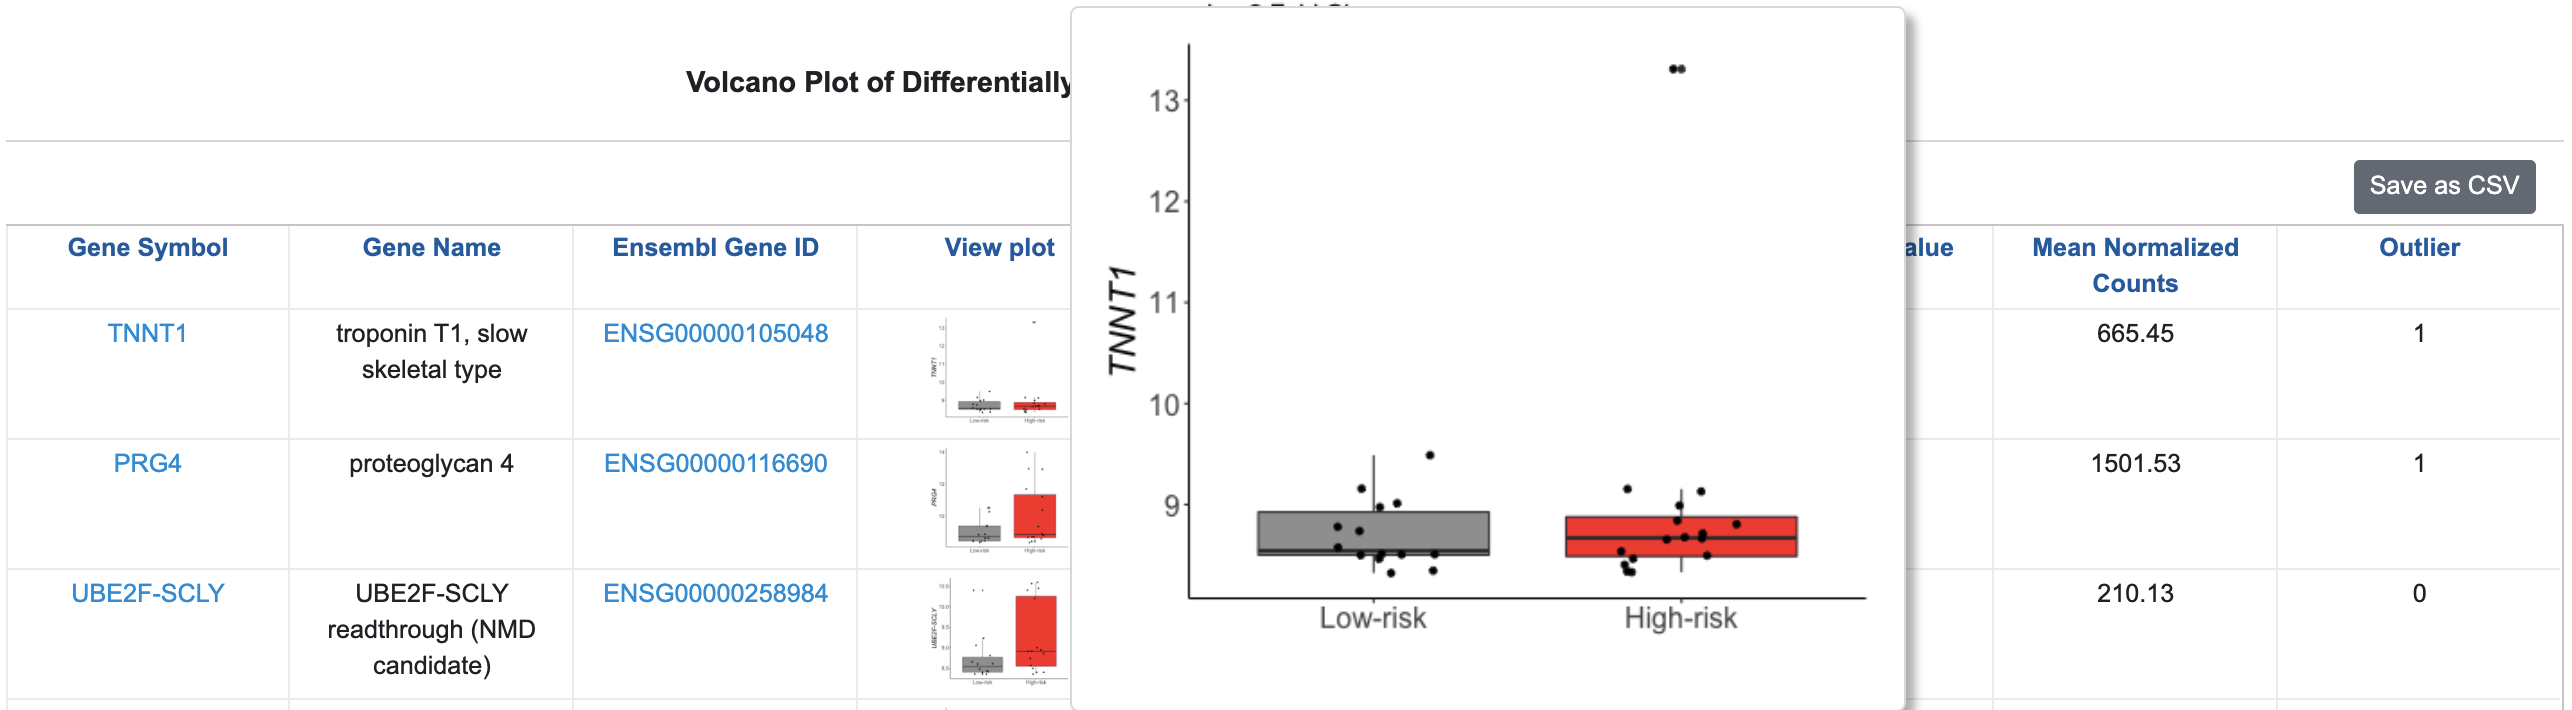
Then, by clicking on the Log2 Fold Change column header to sort the column, you’ll see that the gene with the largest fold change is TNNT1. Notice that this gene was flagged as an Outlier, indicating that outlying samples influence the fold change. This is evident in the figure.
The whole dataset and any filtered versions can be downloaded by clicking “Save as CSV.” To get more information on a single gene, click on the gene’s Ensembl Gene ID or Gene Symbol in the table to open a new page focused on that gene.
Genome-wide APOL1 Correlations View
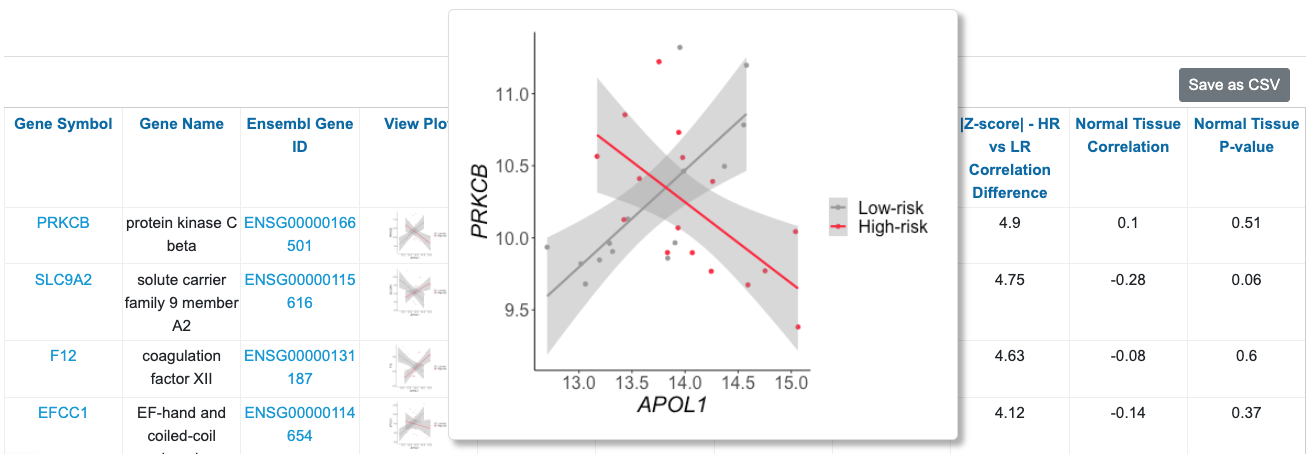
This table contains the correlation between APOL1 and 15,703 glomerular-expressed, protein-coding genes. Results can be filtered by Gene Symbol, Ensembl Gene ID, correlation thresholds (toggle > and < commands), and/or significance in high-risk or low-risk groups. The table of results can also be sorted by clicking column headers.
You can sort by |Z-score| - HR vs. LR Correlation Difference to identify genes with significant differences in APOL1 correlation in the high-risk vs. low-risk groups. Here we see a scatter plot of PRKCB illuminating the difference in correlations in the high-risk vs. low-risk group. There is also a column presenting the correlation between these two genes in healthy tissue. In this case, APOL1 and PRKCB are not correlated in healthy tissue.
Additionally, you can search for genes and set of genes. For example, if you wanted to know if any NF-kB genes were differentially correlated with high-risk vs. low-risk APOL1, you would type “NFKB” in the Gene Symbol search (which will pull up any gene with “NFKB” in the gene symbol), then sort by |Z-score| HR vs. LR Correlation Difference. You can see that among these genes, NFKB1 has the largest correlation change between high-risk and low-risk (|Z-score| = 3.73). You can hover over the figure to visualize the correlations. Also, you can observe that in normal tissue, APOL1 and NFKB1 are not significantly correlated.
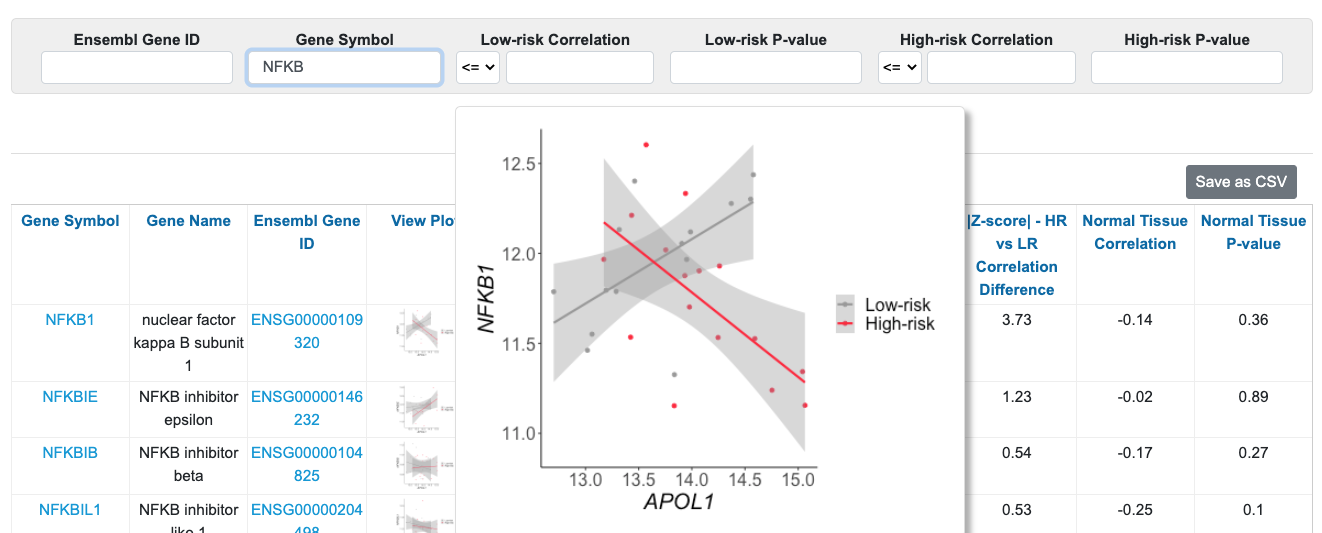
To learn more about NFKB1, or any other gene, you can click on the gene name to link to the gene view.
Differential Co-expression View
This table contains the module and submodule assignment from the differential co-expression analysis. Genes can be filtered by Gene Symbol, Ensembl Gene ID, Module, and Submodule, and sorted by clicking column headers.
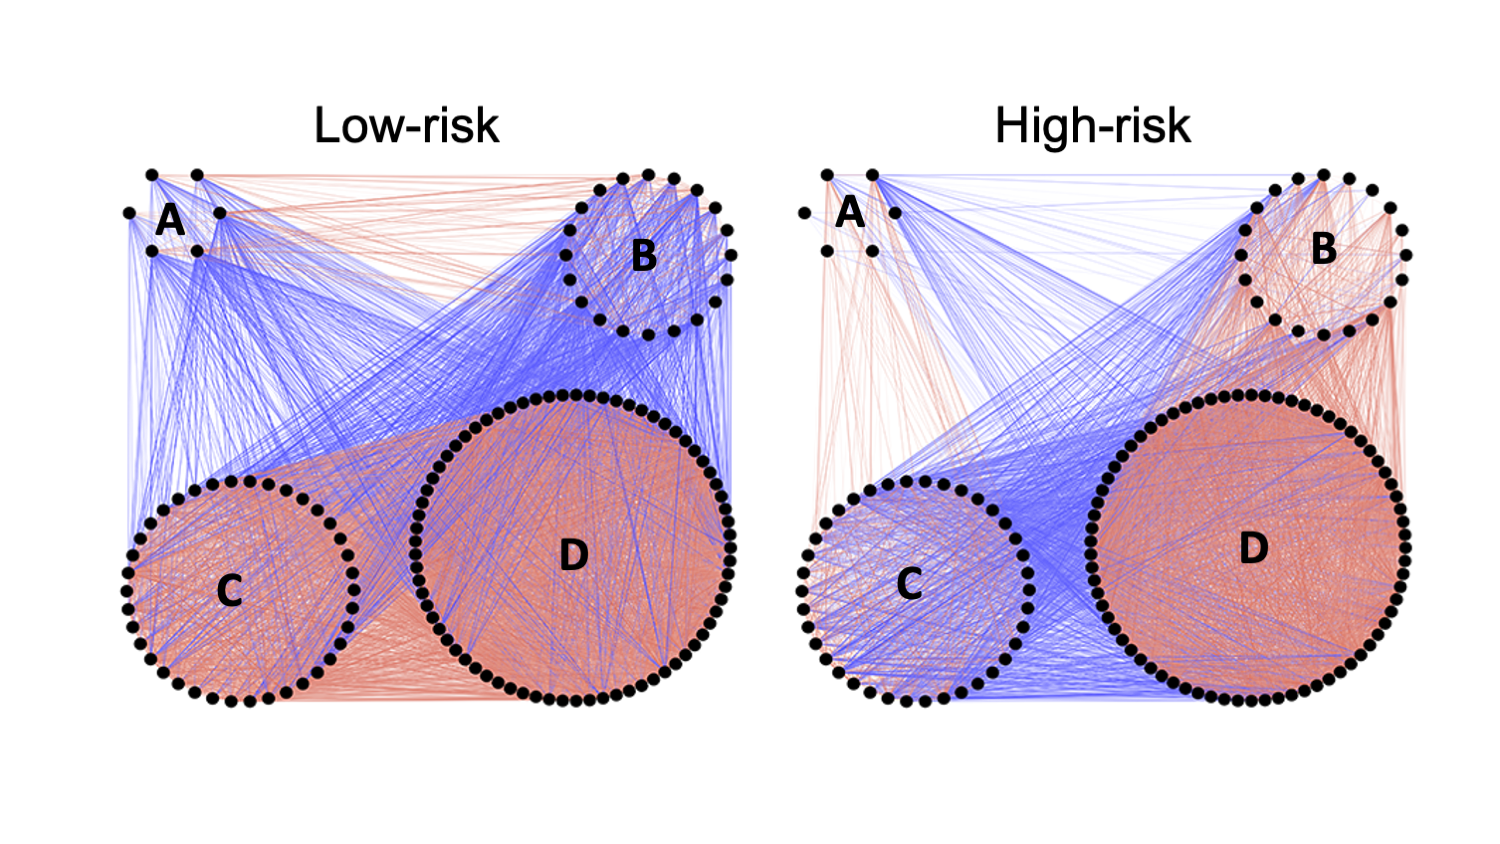
For example, in the image below you can see that the correlations between submodules C and D change between groups, with positive correlations in low-risk and negative correlations in high-risk.
You can filter for these two submodules and sort by Intra-module Normalized Gene Connectivity. The genes toward the top of the list have the largest changes in correlation with all other “Green” module genes, i.e., most differentially expressed. Click the "Save as csv" button to download the entire table.
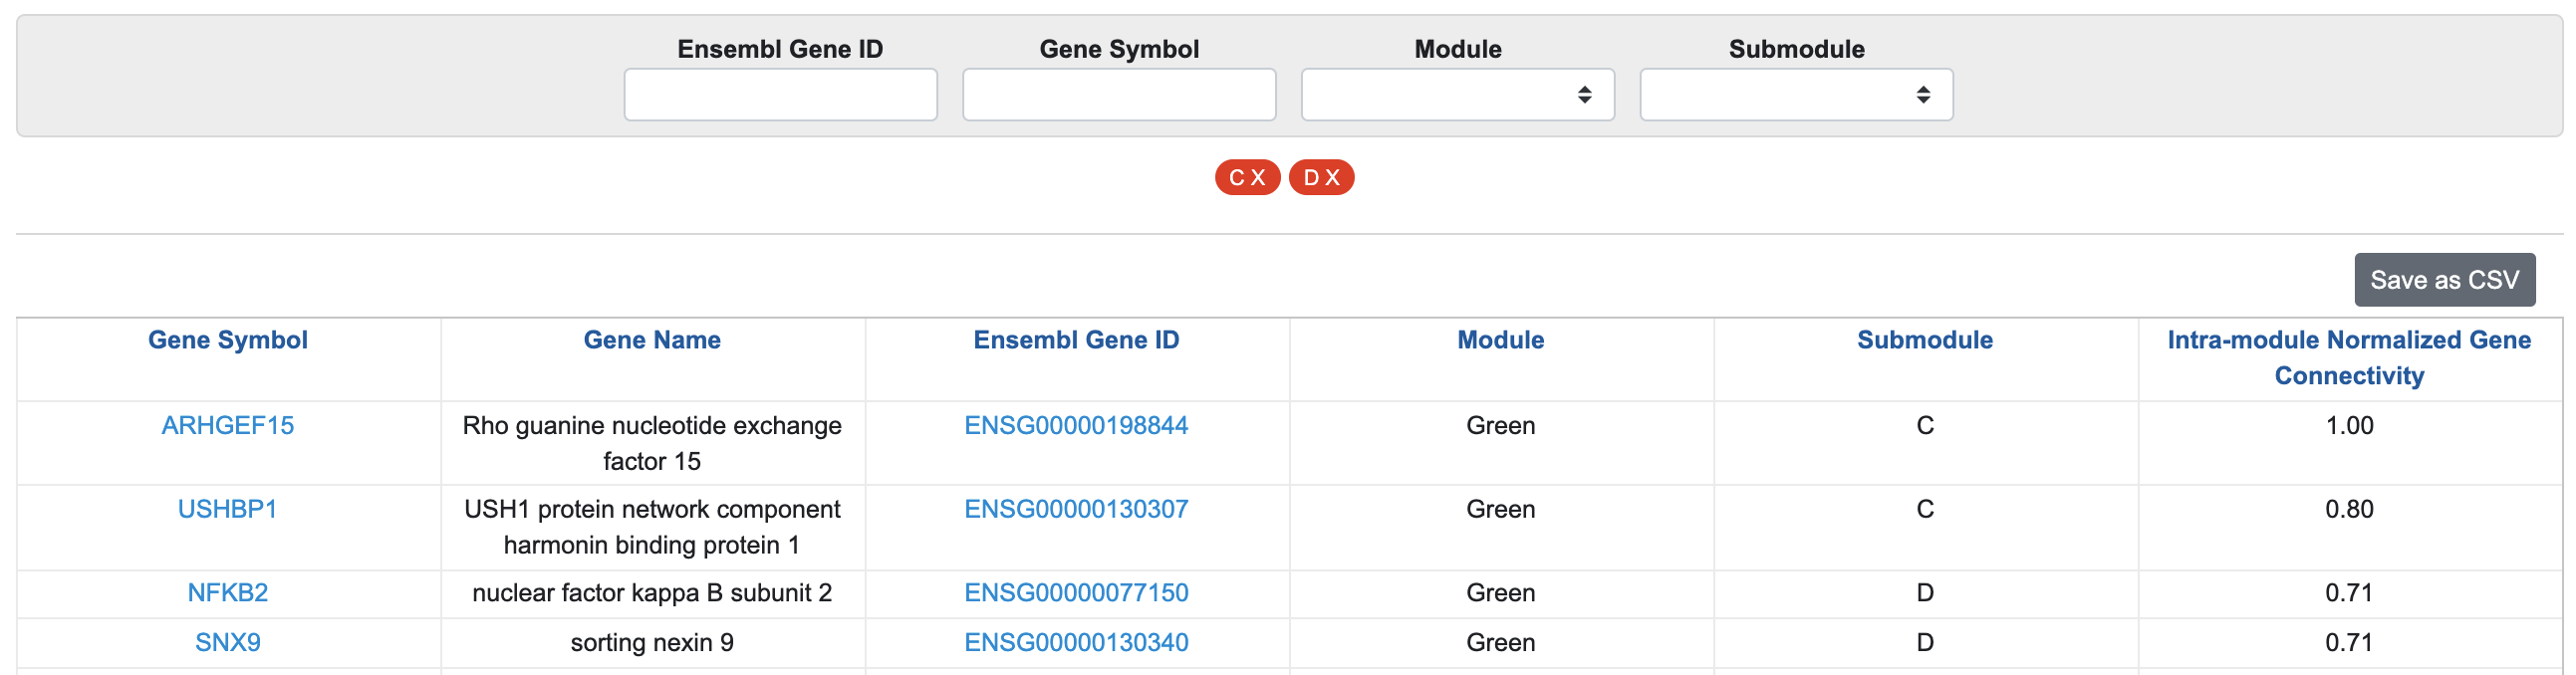
In this example, we see that SNX9, a gene involved in intracellular trafficking, shows strong differential co-expression between high-risk and low-risk groups (given the large intra-module normalized connectivity). By clicking on the gene name, we can learn more about it.
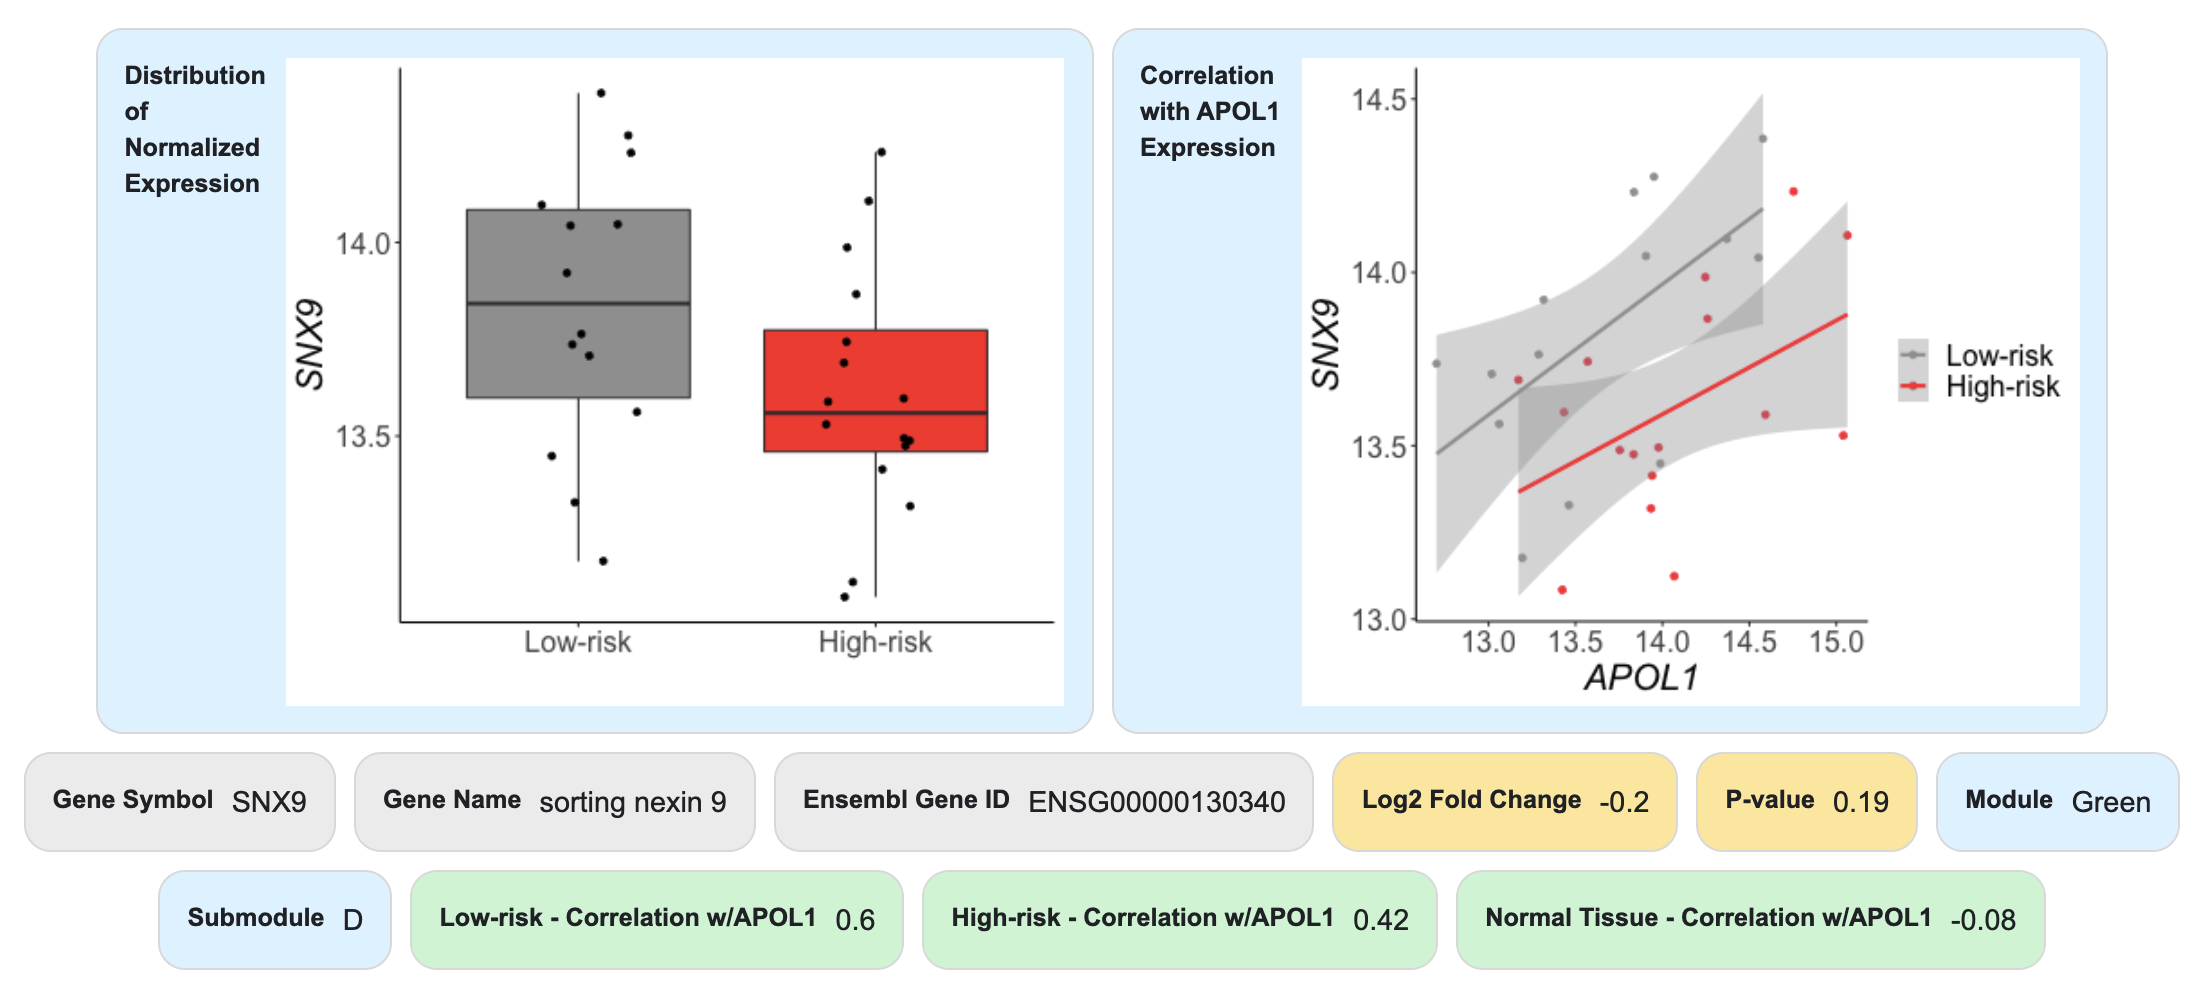
Here we learn that SNX9 is not significantly differentially expressed between high-risk and low-risk groups. SNX9 is positively correlated with APOL1 in high-risk and low-risk samples but is not correlated in normal tissue.
To learn more about submodule D, or any other module/submodule, you can click on "Gene Set Enrichment Analysis" from the Differential Co-expression analysis view.
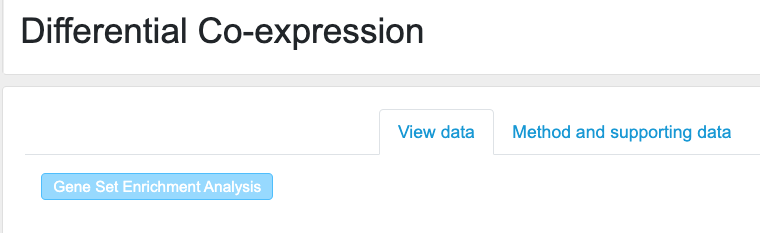
From there, you can view the DAVID results interactively under the “View data” tab, or you can download results under the "Method and supporting data" tab.
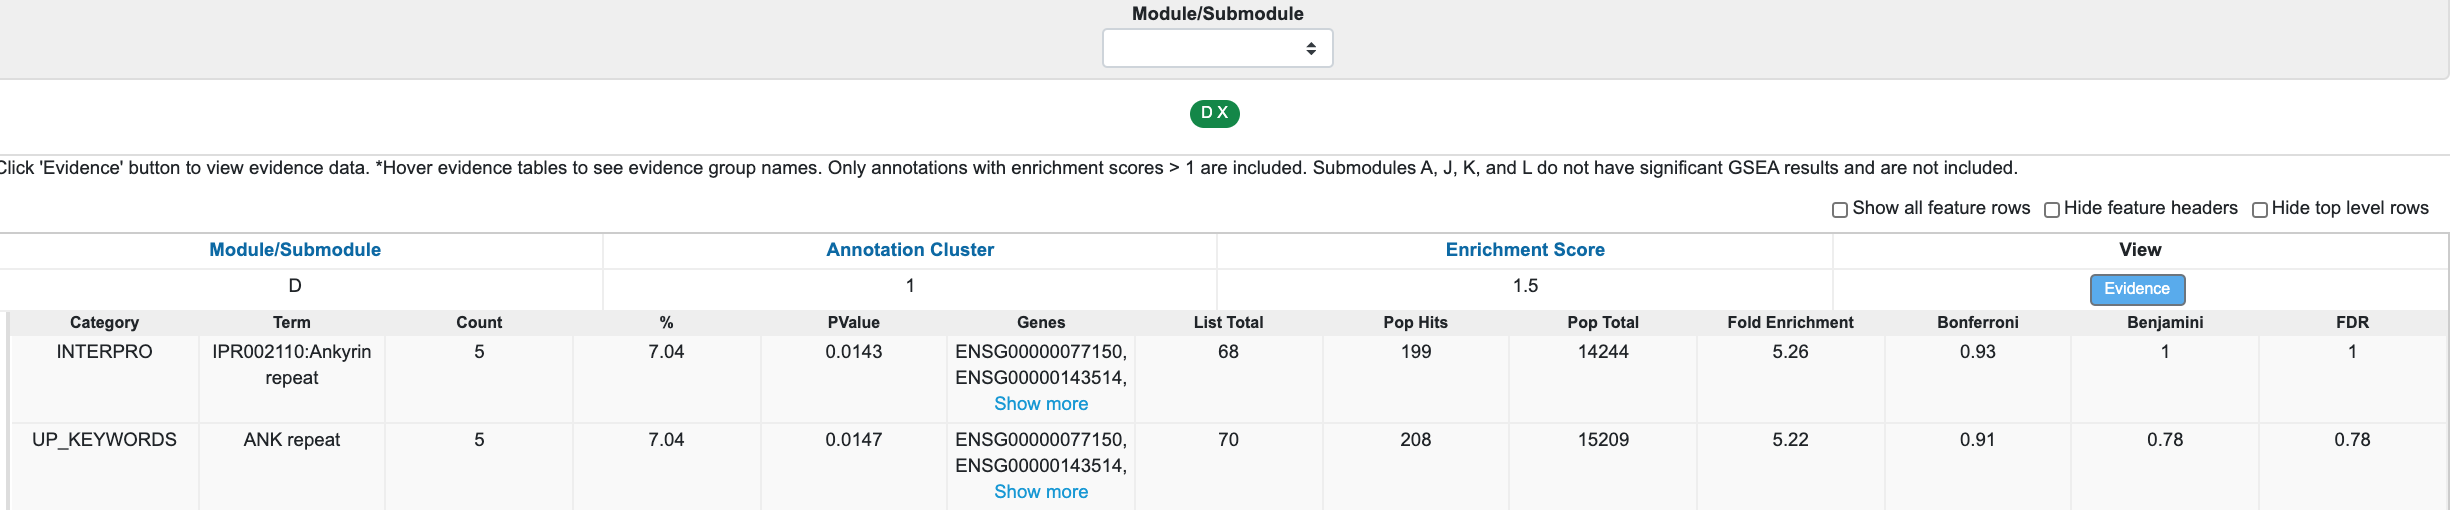
For submodule D, we see enrichment for "Ankyrin repeat"; however, this is not significant after Bonferroni multiple-testing adjustment.
If you are interested in using other gene set enrichment methods, you can download the list of genes from the "Differential Co-expression" table.
Interactive App
The interactive R shiny app can be used to explore correlation analyses. All genes are included along with clinical covariates (age, sex, estimated glomerular filtration rate [eGFR], and urine protein creatinine ratio [UPCR]). The gene expression signatures of the submodules are summarized with eigengenes.
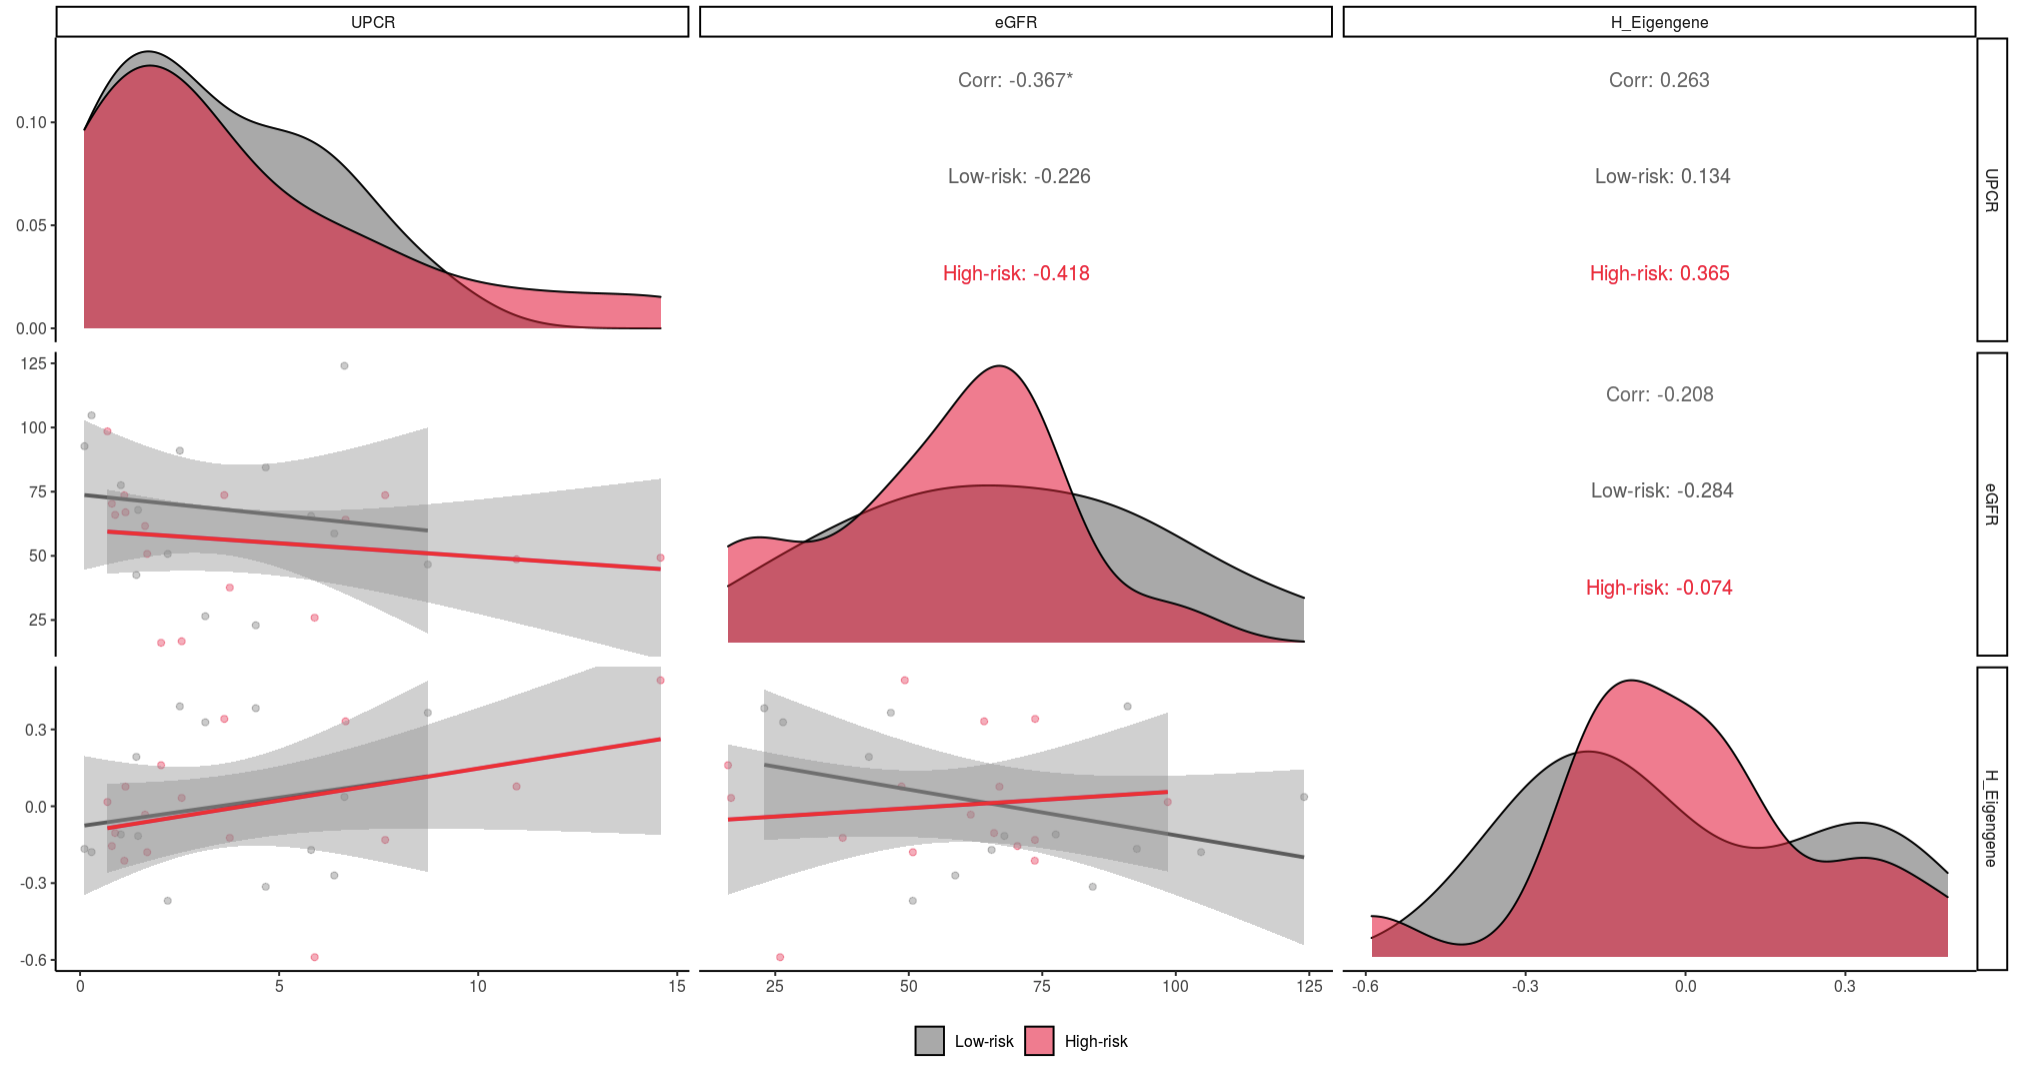
One example highlighting the app’s utility includes the correlation between submodules (eigengenes) and APOL1 expression. In this example, we’re investigating the relationship between APOL1 expression and the G and H submodules.
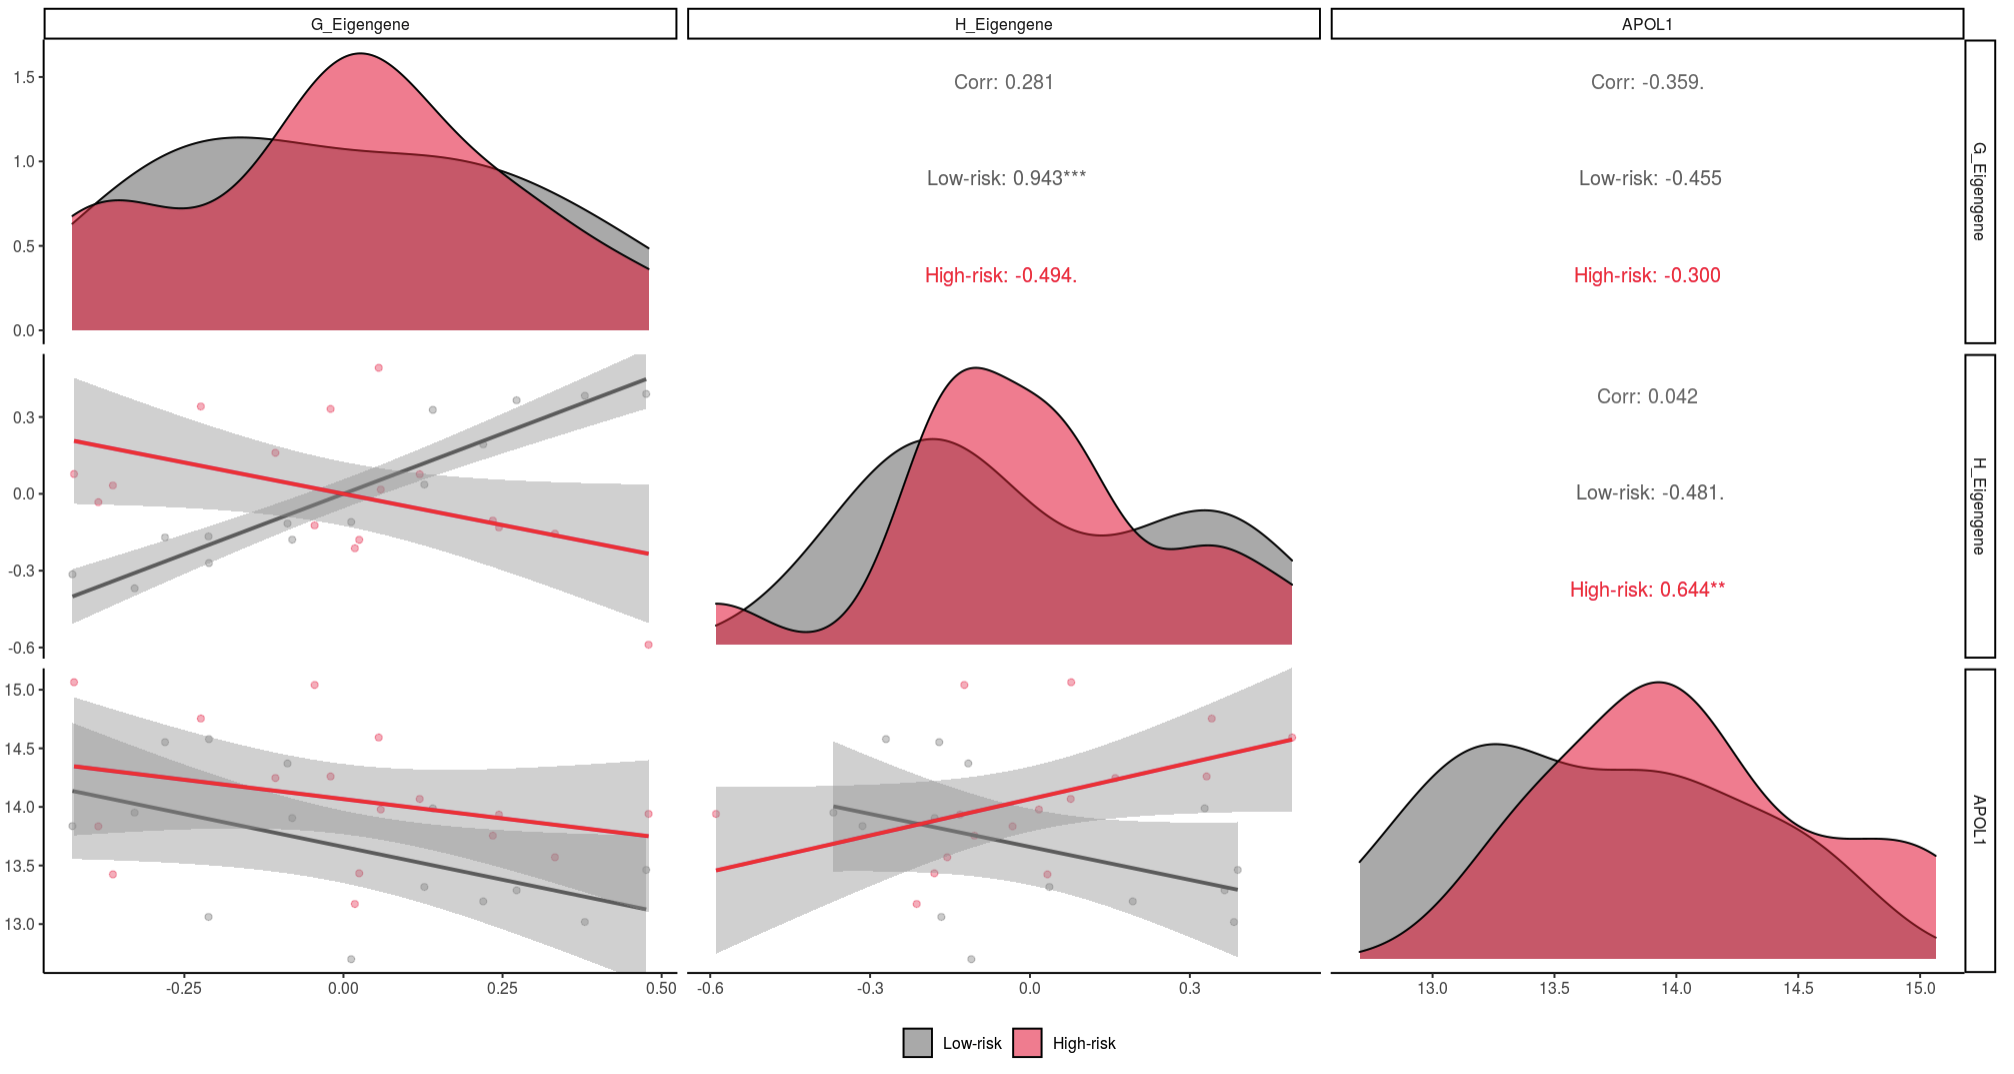
In these figures, distributions for each input are along the diagonal. For each x and y pair, scatter plots, and linear trends are plotted below the diagonal, and Spearman correlations with p-value indicator are above the diagonal.
Here we see that high-risk APOL1 expression had a significant (0.001 < p < 0.01) positive correlation with the genes in submodule H, while low-risk samples had a non-significant negative correlation (0.05 < p < 0.10).
We can then see if submodule H is associated with kidney function, measured by eGFR and UPCR. In this case, eGFR and UPCR are not correlated with submodule H genes.